Stay Updated
Get the latest insights on creative testing and ad optimization delivered to your inbox.
Get the latest insights on creative testing and ad optimization delivered to your inbox.
Continue reading about this topic with these recommended articles.
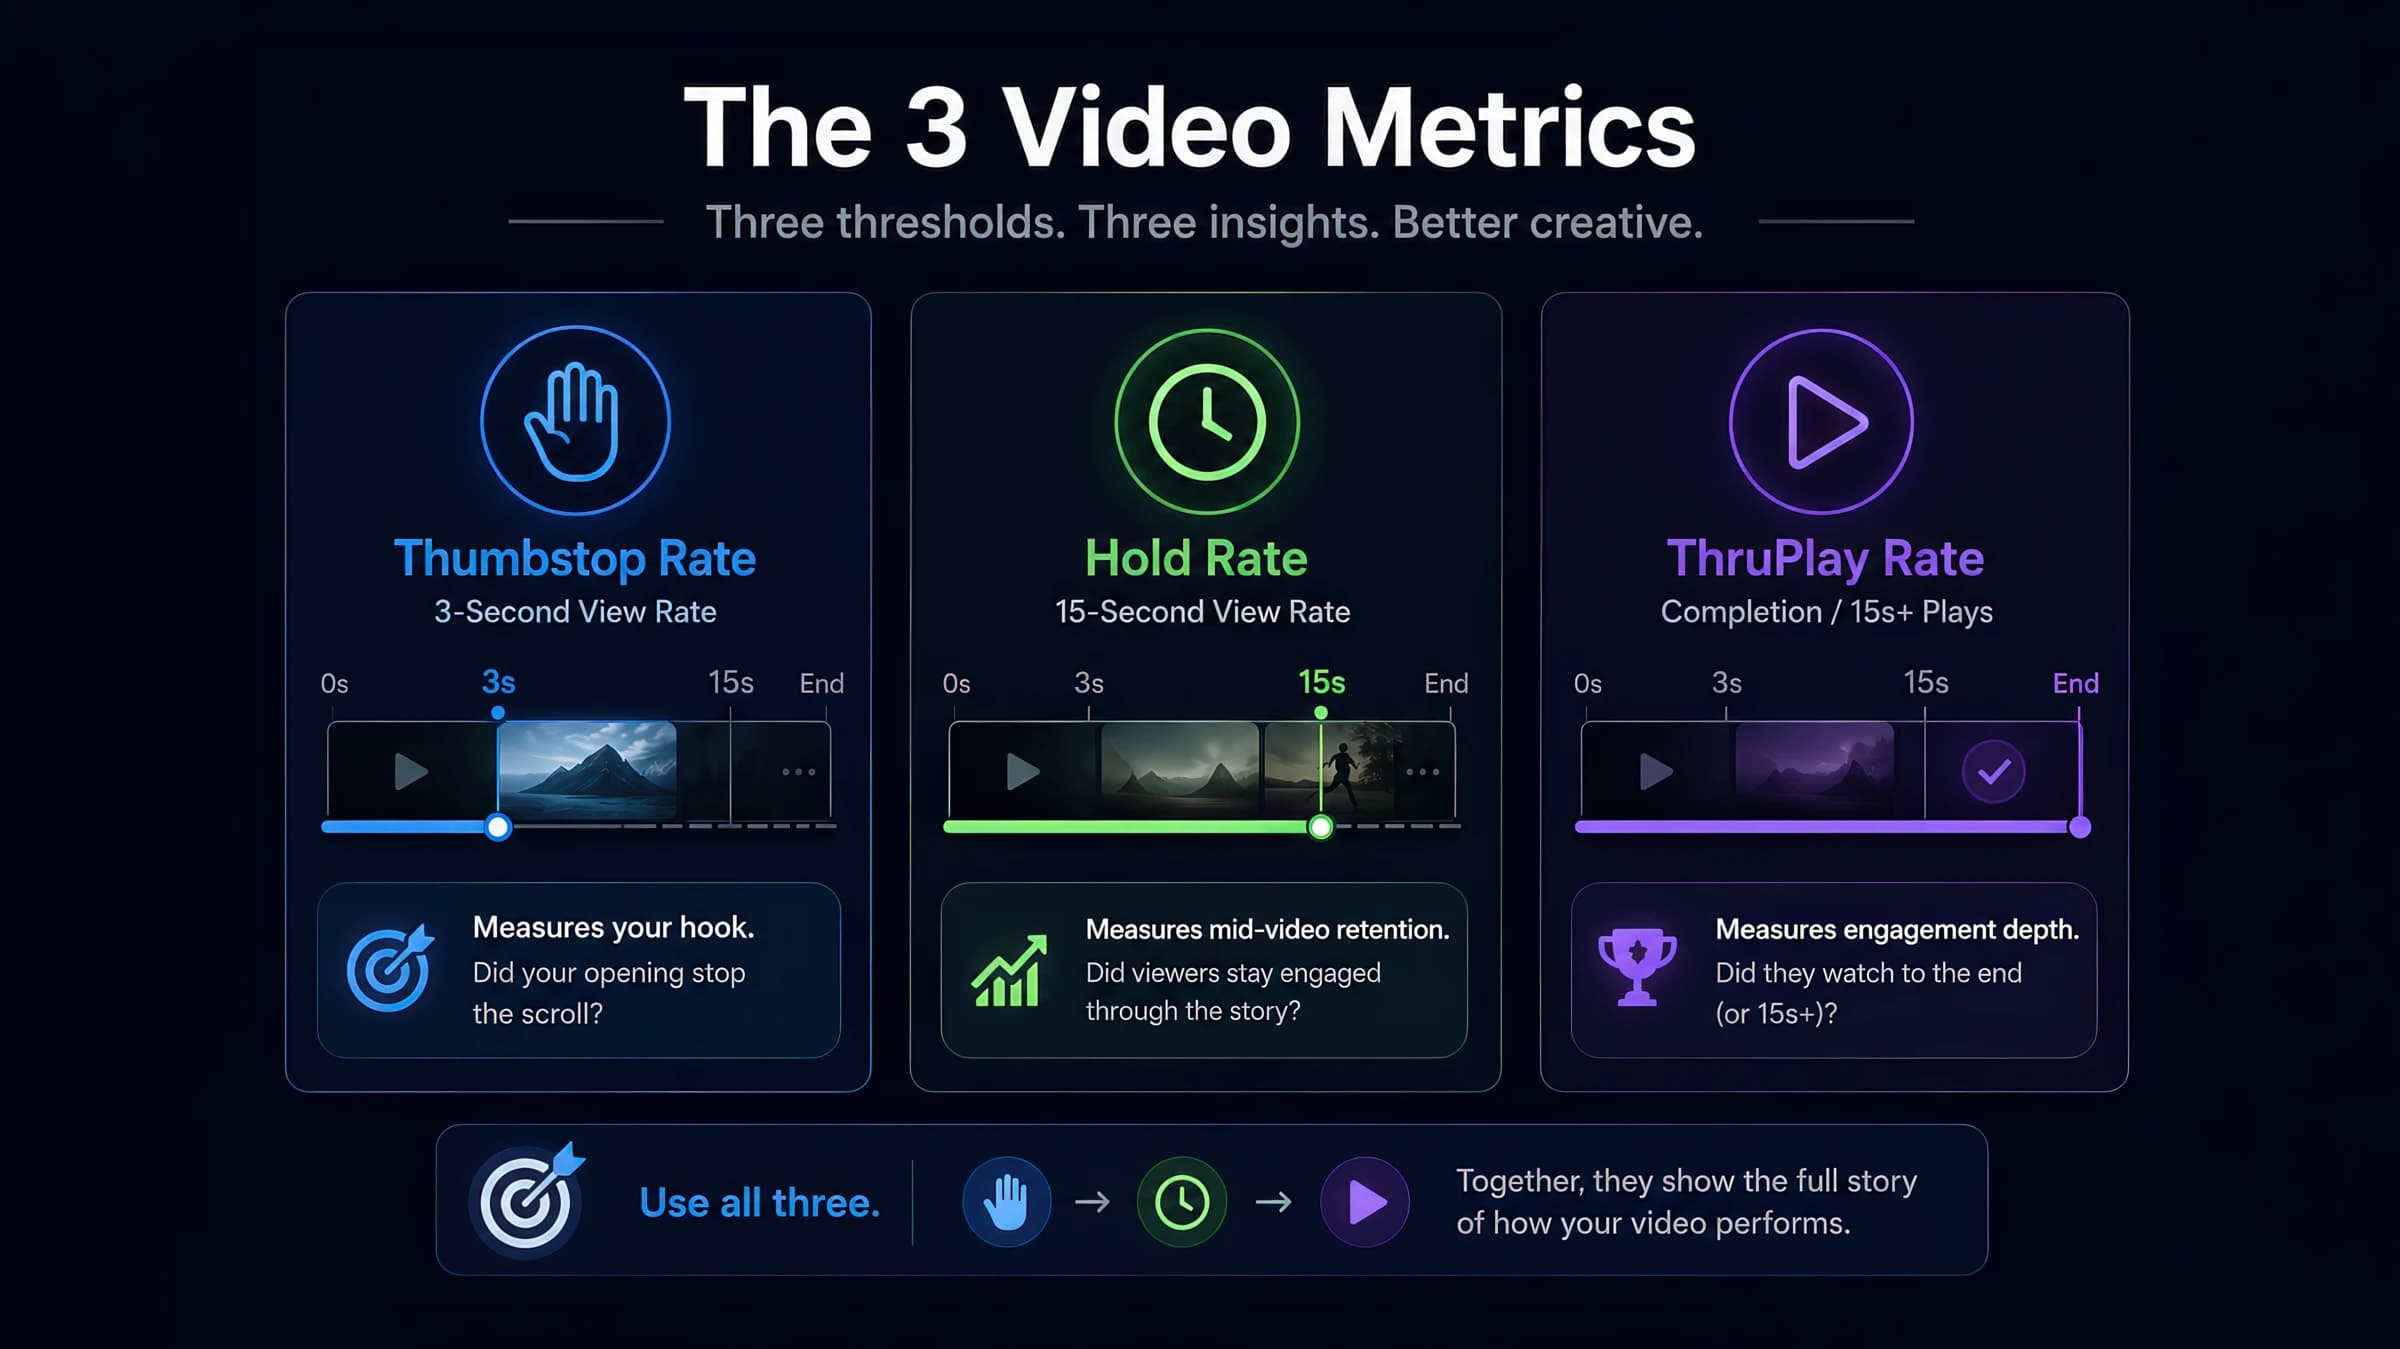
Meta Ads Manager hides the creative diagnostics that matter behind custom columns. This walkthrough shows exactly where to find thumbstop, hold, and ThruPlay — and how to read them without false conclusions.

AI-powered marketing tools
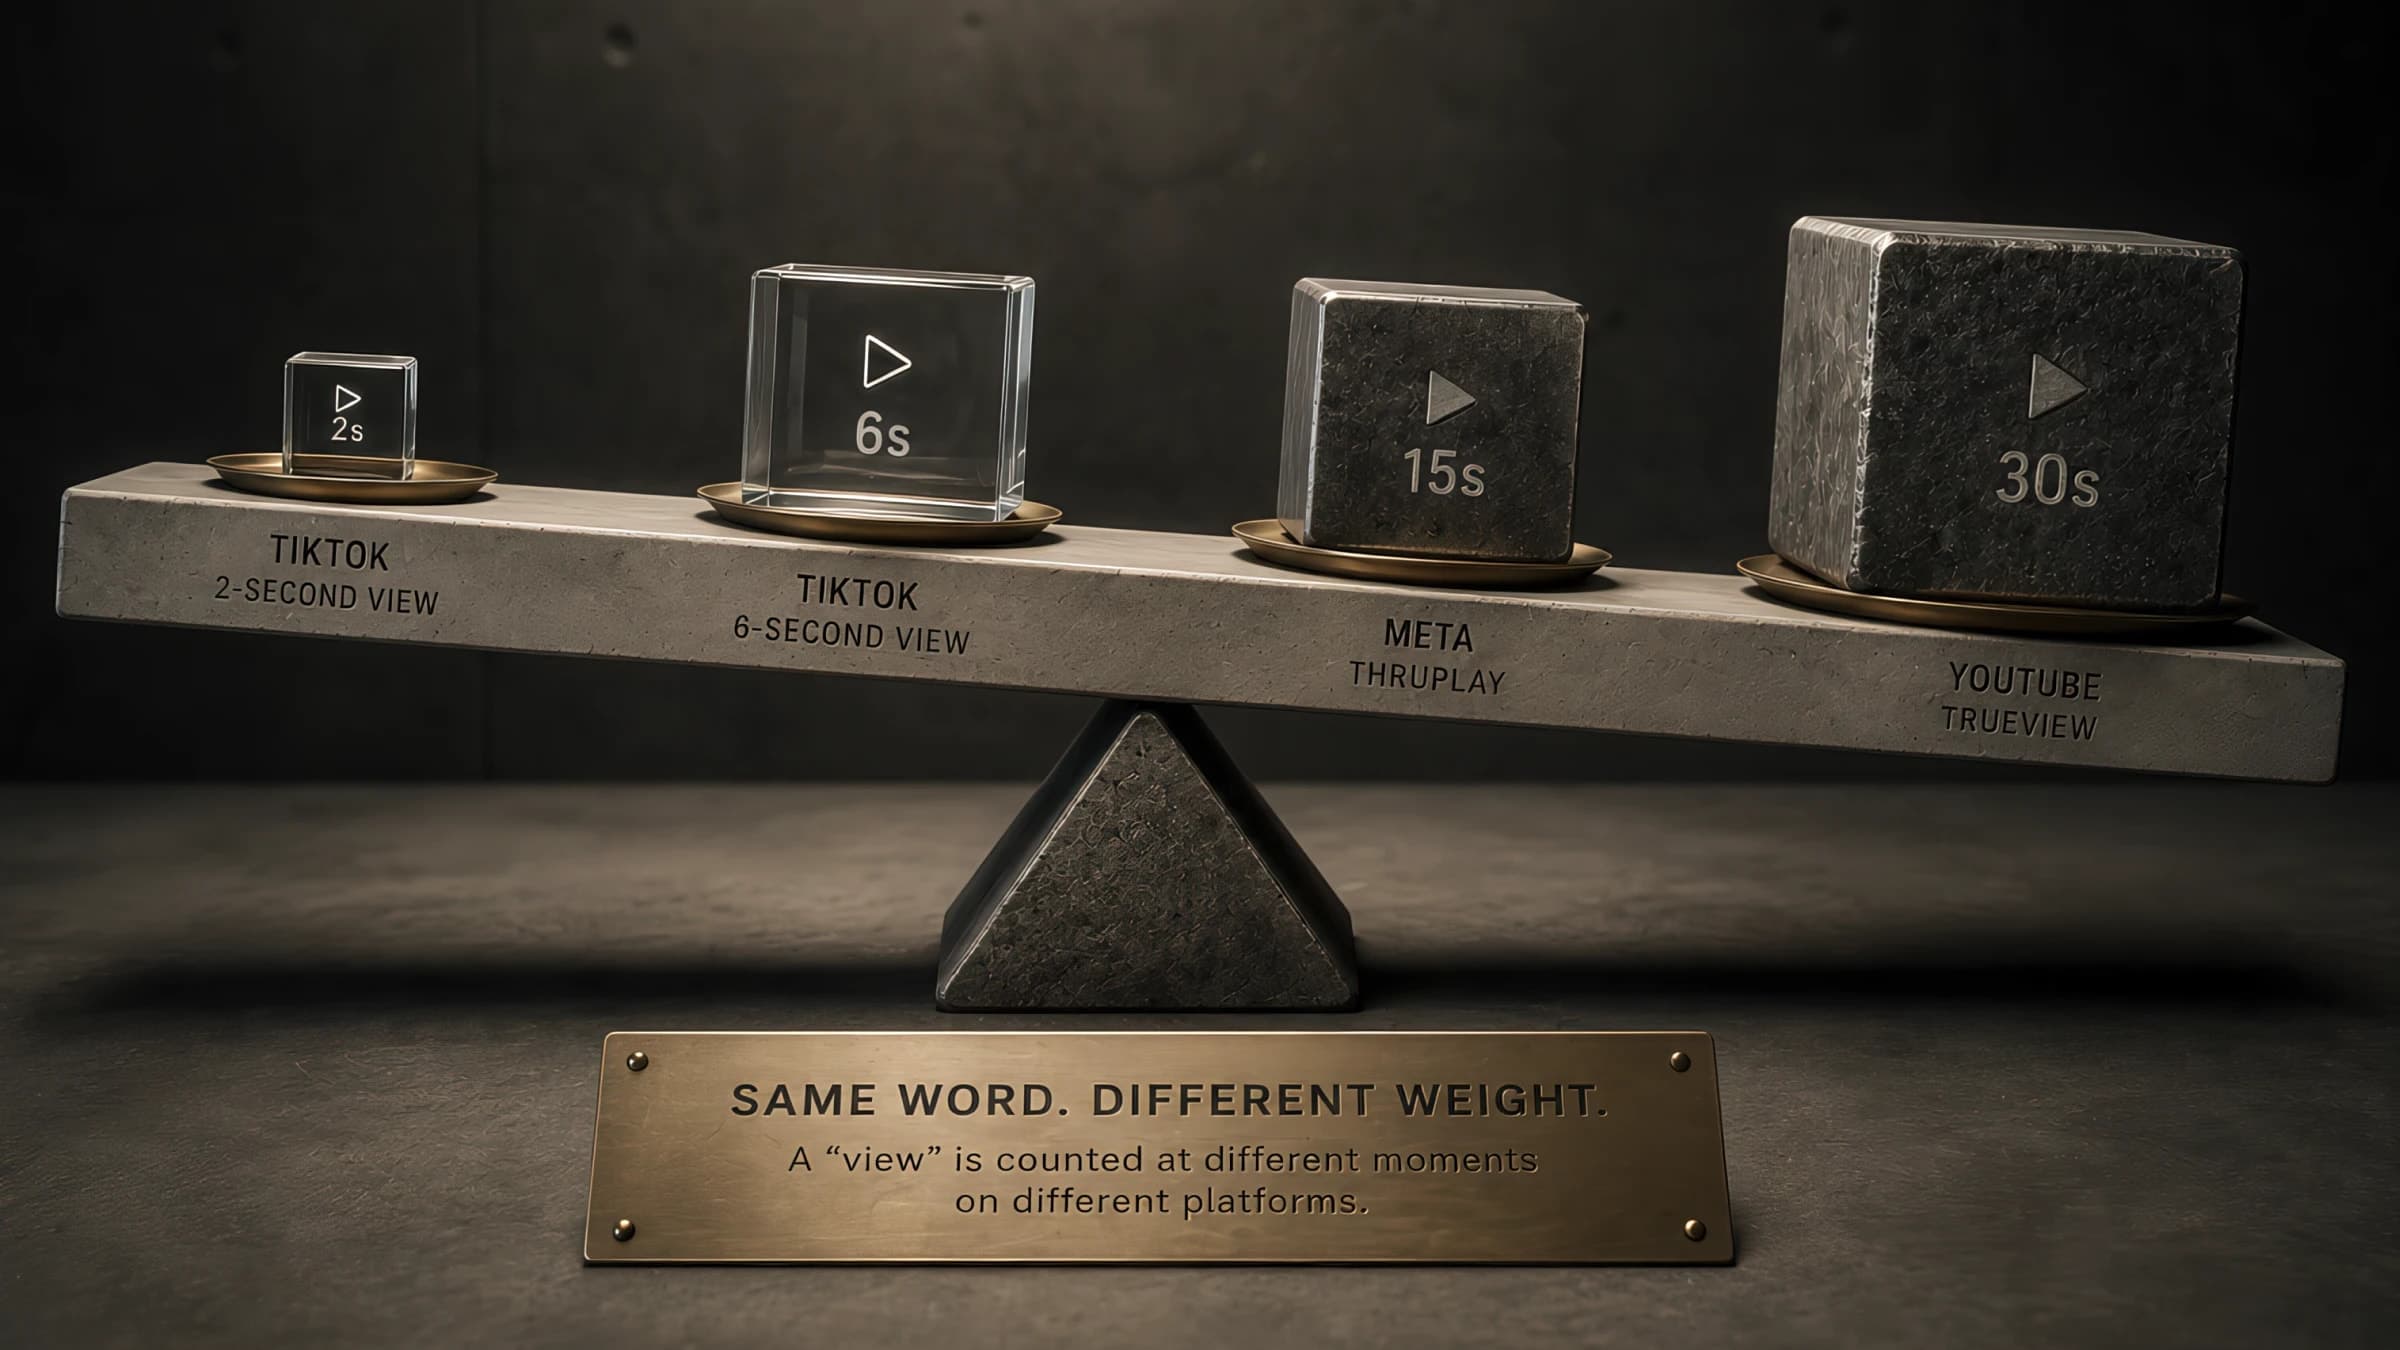
ThruPlay is a Meta-specific term, but the underlying mechanic — counting a view at a specific threshold — exists differently on TikTok, YouTube, and CTV. Here's how the metrics actually compare and where cross-platform benchmarks break down.
AI-powered marketing tools
Step-by-step formulas for the three core video-engagement metrics — Video Completion Rate, ThruPlay Rate, and View-Through Rate — with worked examples and the platform-specific quirks that trip up cross-platform comparisons.
AI-powered marketing tools

Learn how to calculate video completion rate step by step, then run your own numbers: our free VCR calculator shows what percentage of viewers watch to the end, with full retention and drop-off context. Works from YouTube, Vimeo, TikTok, and Facebook analytics data — benchmarked against platform averages.

Analyze audience drop-off and retention to find exactly where viewers stop watching your videos. Works for YouTube, Vimeo, TikTok, and Facebook analytics data.
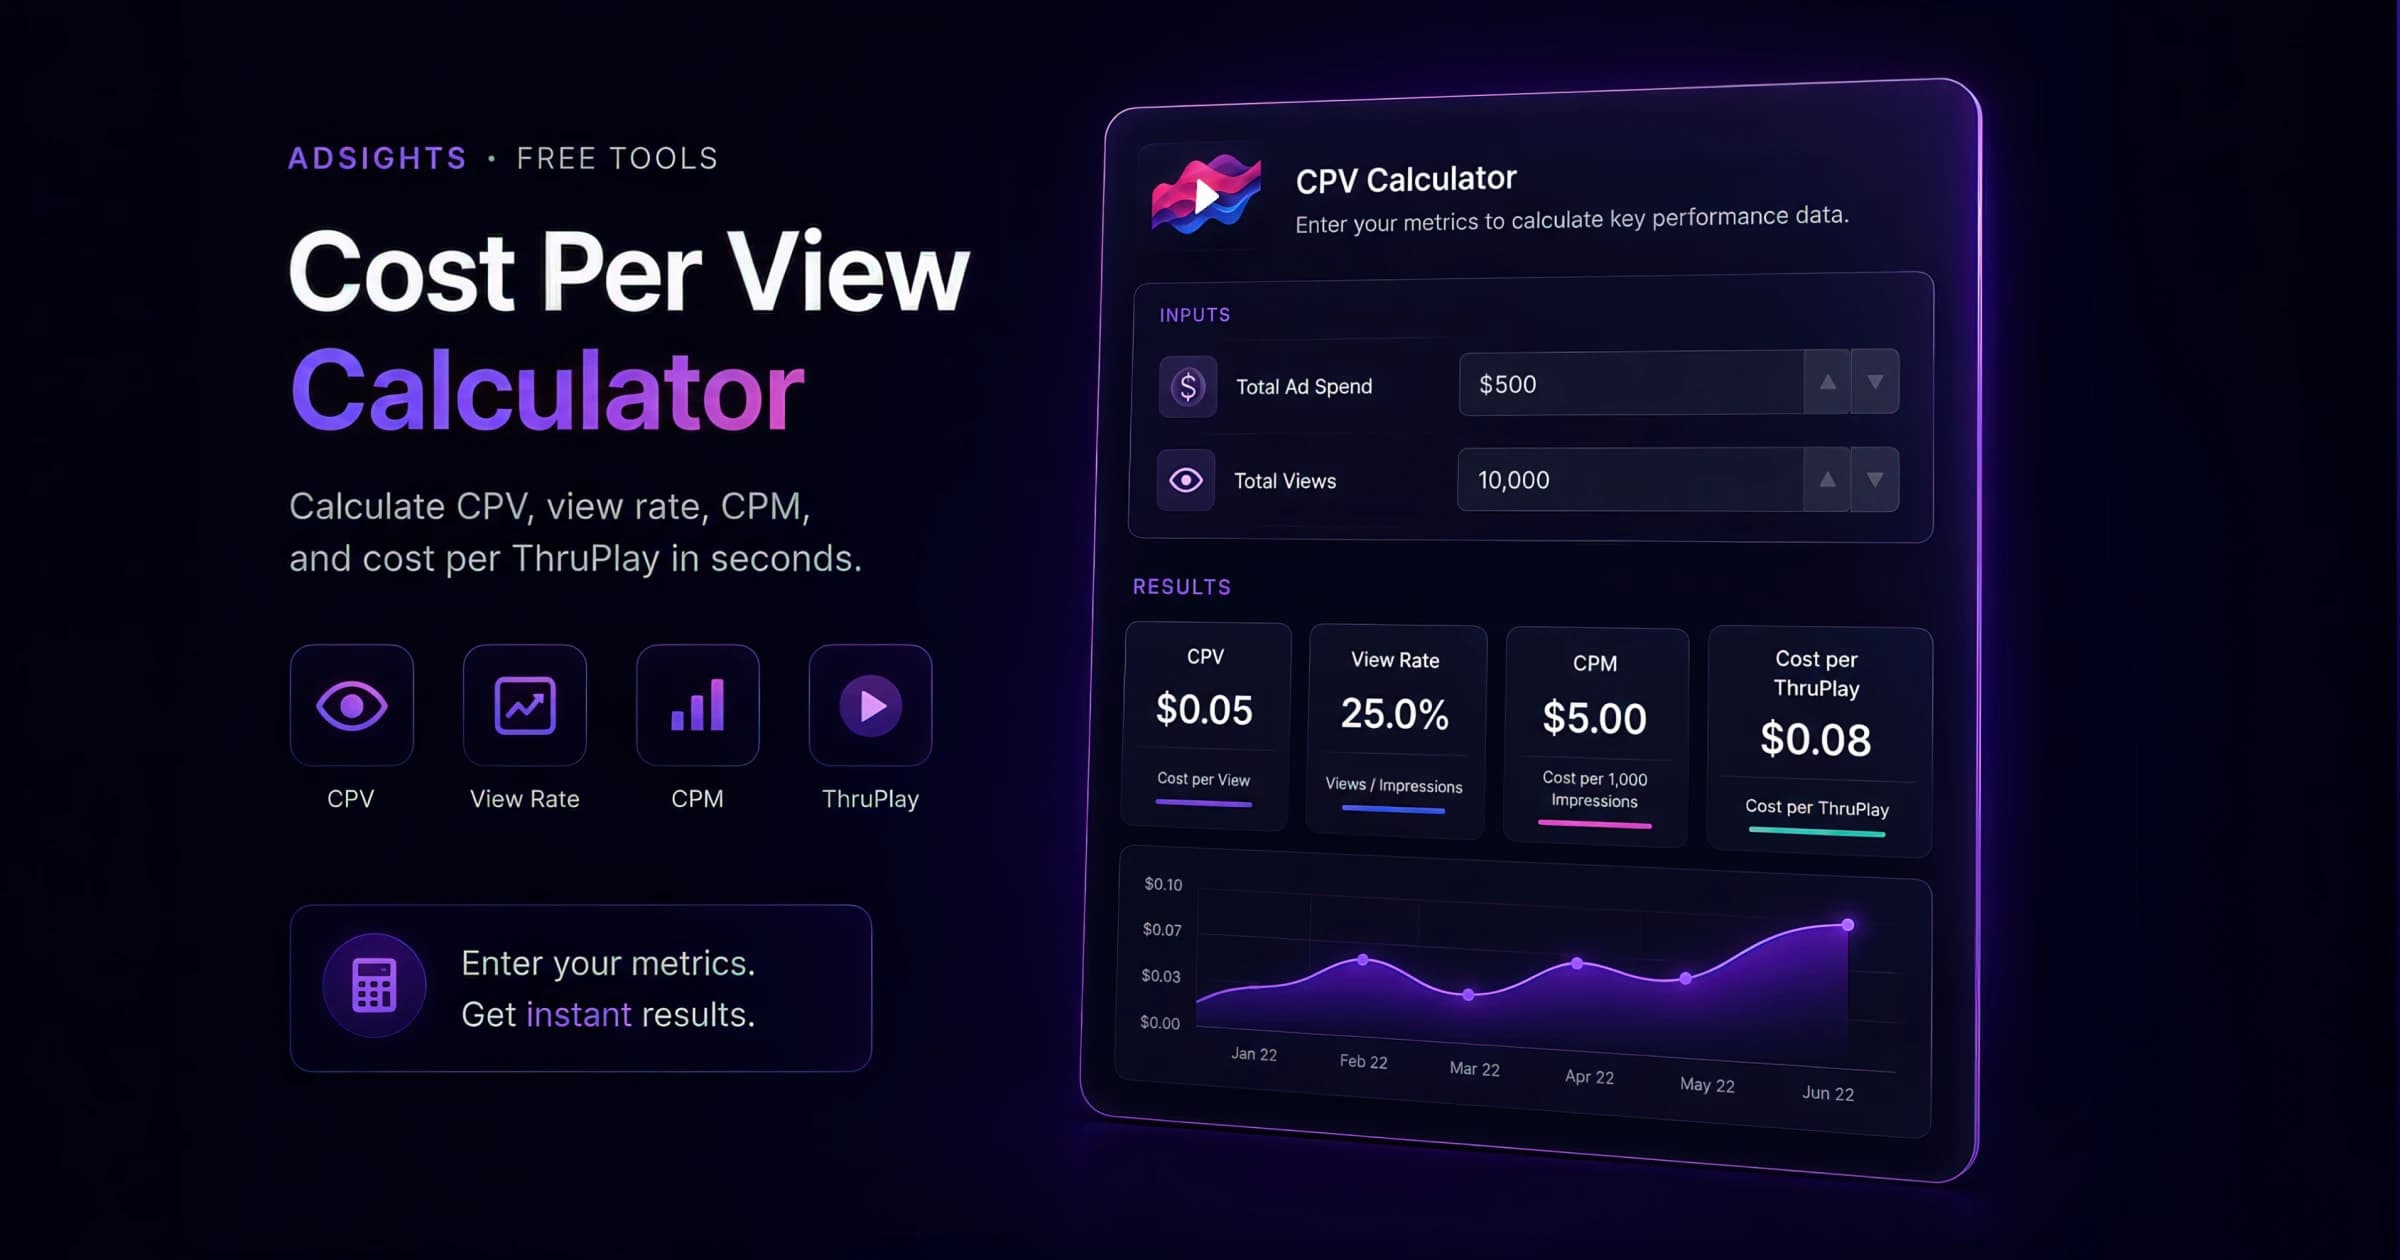
Free CPV calculator for video campaigns. Enter spend and counted views to get cost per view. Add impressions for view rate and CPM, or ThruPlays for cost per ThruPlay — with worked examples, platform view definitions, and 2026 benchmarks for YouTube, Meta, and TikTok.
ThruPlay Rate measures the percentage of video plays where users watch either the entire video (for videos under 15 seconds) or at least 15 seconds (for longer videos). This is the denominator Meta reports against; on Meta, autoplay keeps video plays ≈ impressions. The metric evaluates content's ability to maintain viewer attention and deliver complete messages, particularly important for platforms like Meta and TikTok.
ThruPlay is Meta's standard video-view event, counted when a viewer watches a video to 15 seconds — or to completion if the video is shorter. It is both a reported metric and a biddable optimization/billing event, and it replaced Meta's retired 10-second video view. ThruPlays ÷ video plays gives the ThruPlay Rate; spend ÷ ThruPlays gives Cost Per ThruPlay. The term is Meta-specific.
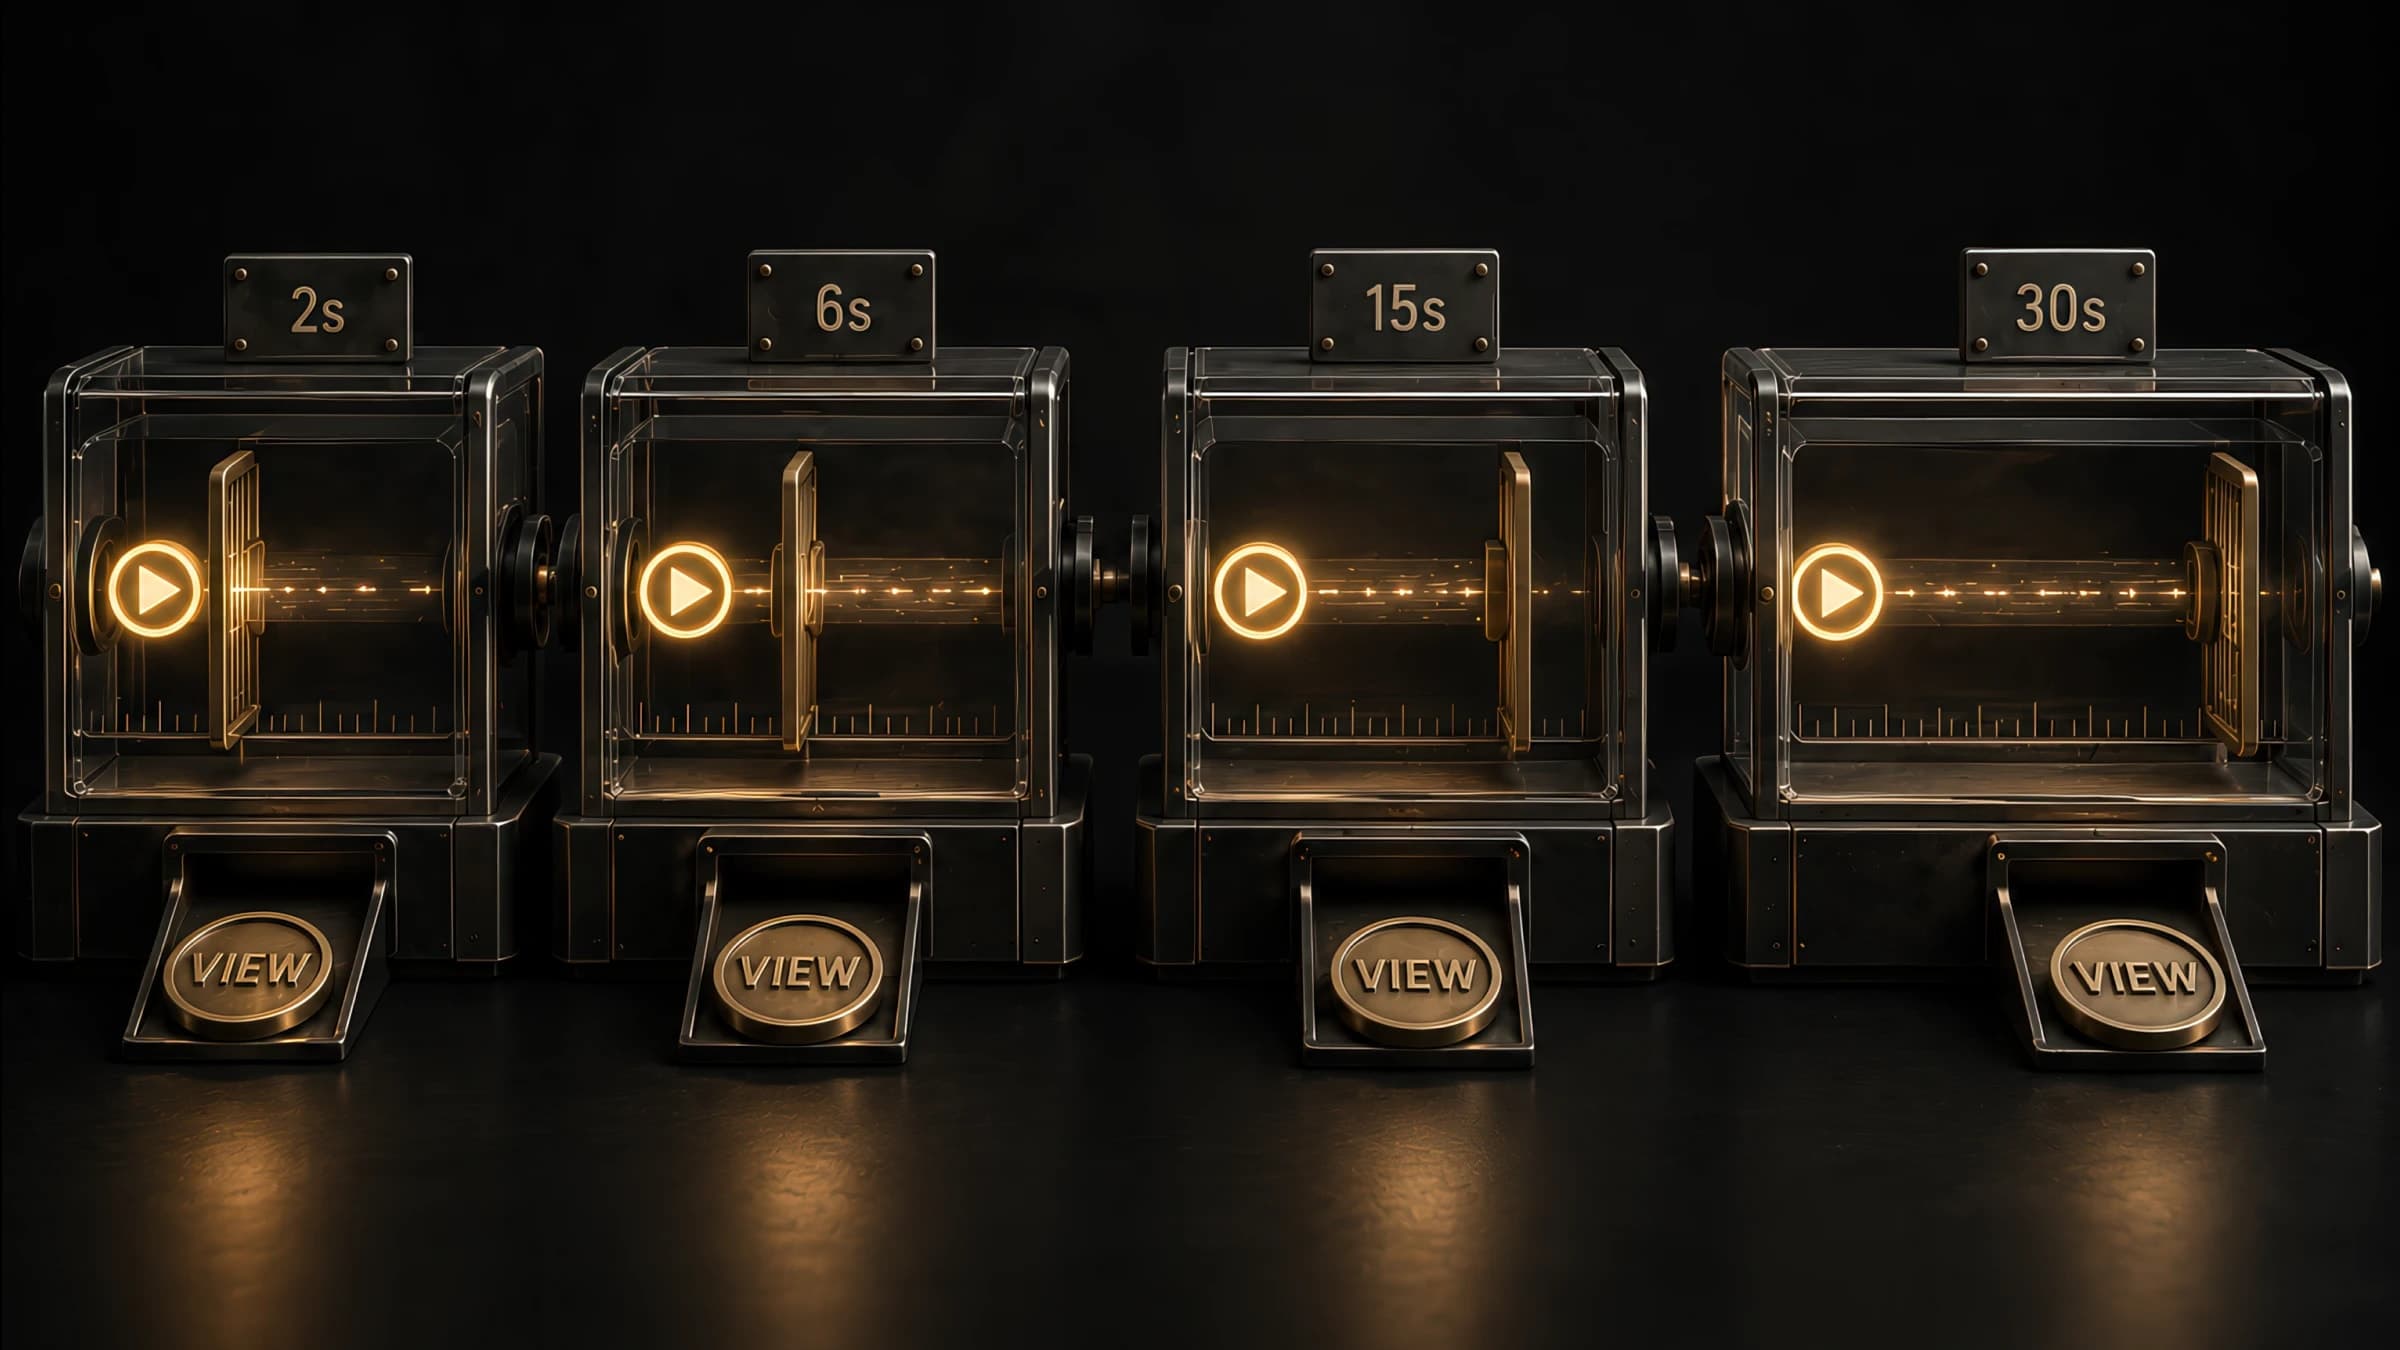
Thumbstop Rate measures the effectiveness of creative in capturing attention by tracking the percentage of users who stop scrolling to engage with the content in their feed for a meaningful duration, typically 2-6 seconds depending on the platform.
Impressions measure the total number of times an advertisement is shown to users, regardless of whether they interact with it. Each time an ad appears on a screen counts as one impression, though viewability standards may require minimum exposure duration or percentage in view to count as a valid impression.
ThruPlay benchmarks shift 10–30 points by video length, placement, and audience temperature. See the full 2026 segmented data — and which number to actually cite.
Short answer: for cold-prospecting video in the 15–30 second range, a good Meta ThruPlay rate is roughly 18%–25% on Reels/Stories — above 25% is strong, below 10% signals a hook problem. But that number is only meaningful within one video-length, placement, and audience bucket; the segmented table is right below, and you can check your own rate against it instantly. For the consolidated research hub — thumbstop, hold, and ThruPlay in one place — see the Video Creative Metrics Benchmarks 2026 guide. To pull these columns from Ads Manager, use our Meta Ads Manager metrics walkthrough.
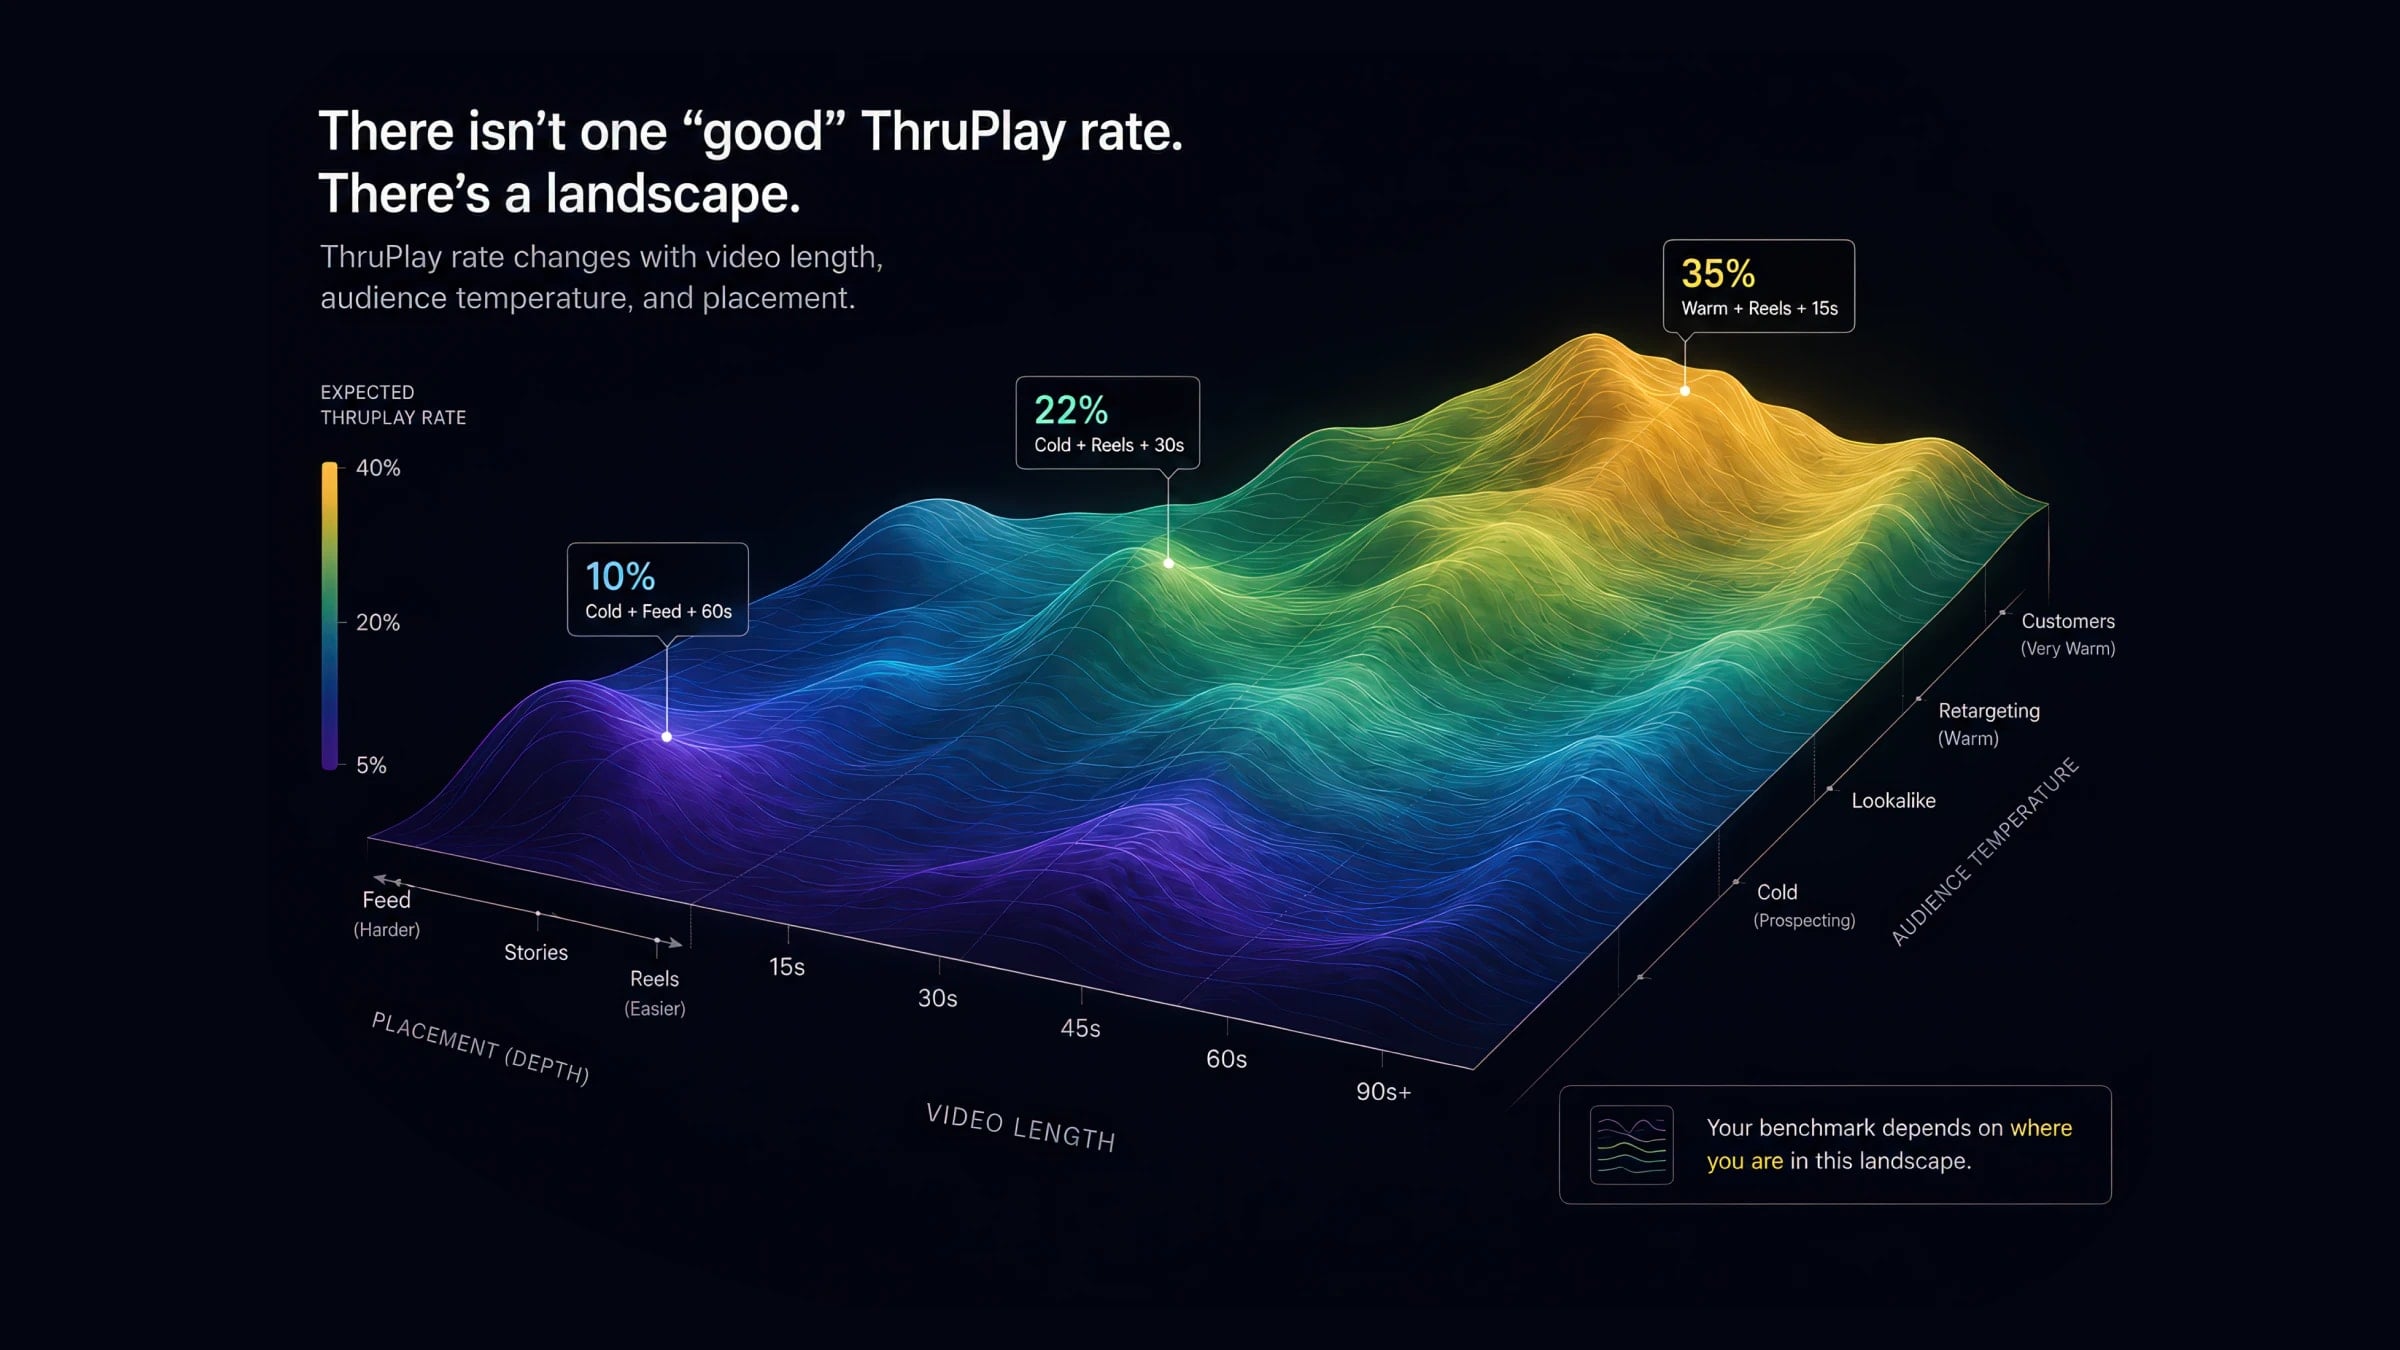
"What's a good ThruPlay rate?" gets a confident answer at the wrong altitude. Ask five Meta operators and four will say "20%" — but the number that matters depends on three variables they rarely qualify: how long the video is relative to the 15-second threshold, what audience temperature is being served, and which placement is delivering the impressions. None of the public benchmark reports we draw on quote a single context-free number; the citable ranges only exist with their full segmentation attached.
A useful single-number anchor for cold-prospecting creative in the 15–30 second range is roughly 18%–25% on Reels/Stories — north of 25% is strong, below 10% suggests retention drop-off before the 15-second mark, which is almost always a hook problem. But that single number hides more than it reveals. The rest of this post lays out what actually moves the benchmark, why, and what to compare to before you decide whether a campaign is healthy — and equally important, which numbers you'll see quoted elsewhere are measuring something that isn't ThruPlay.
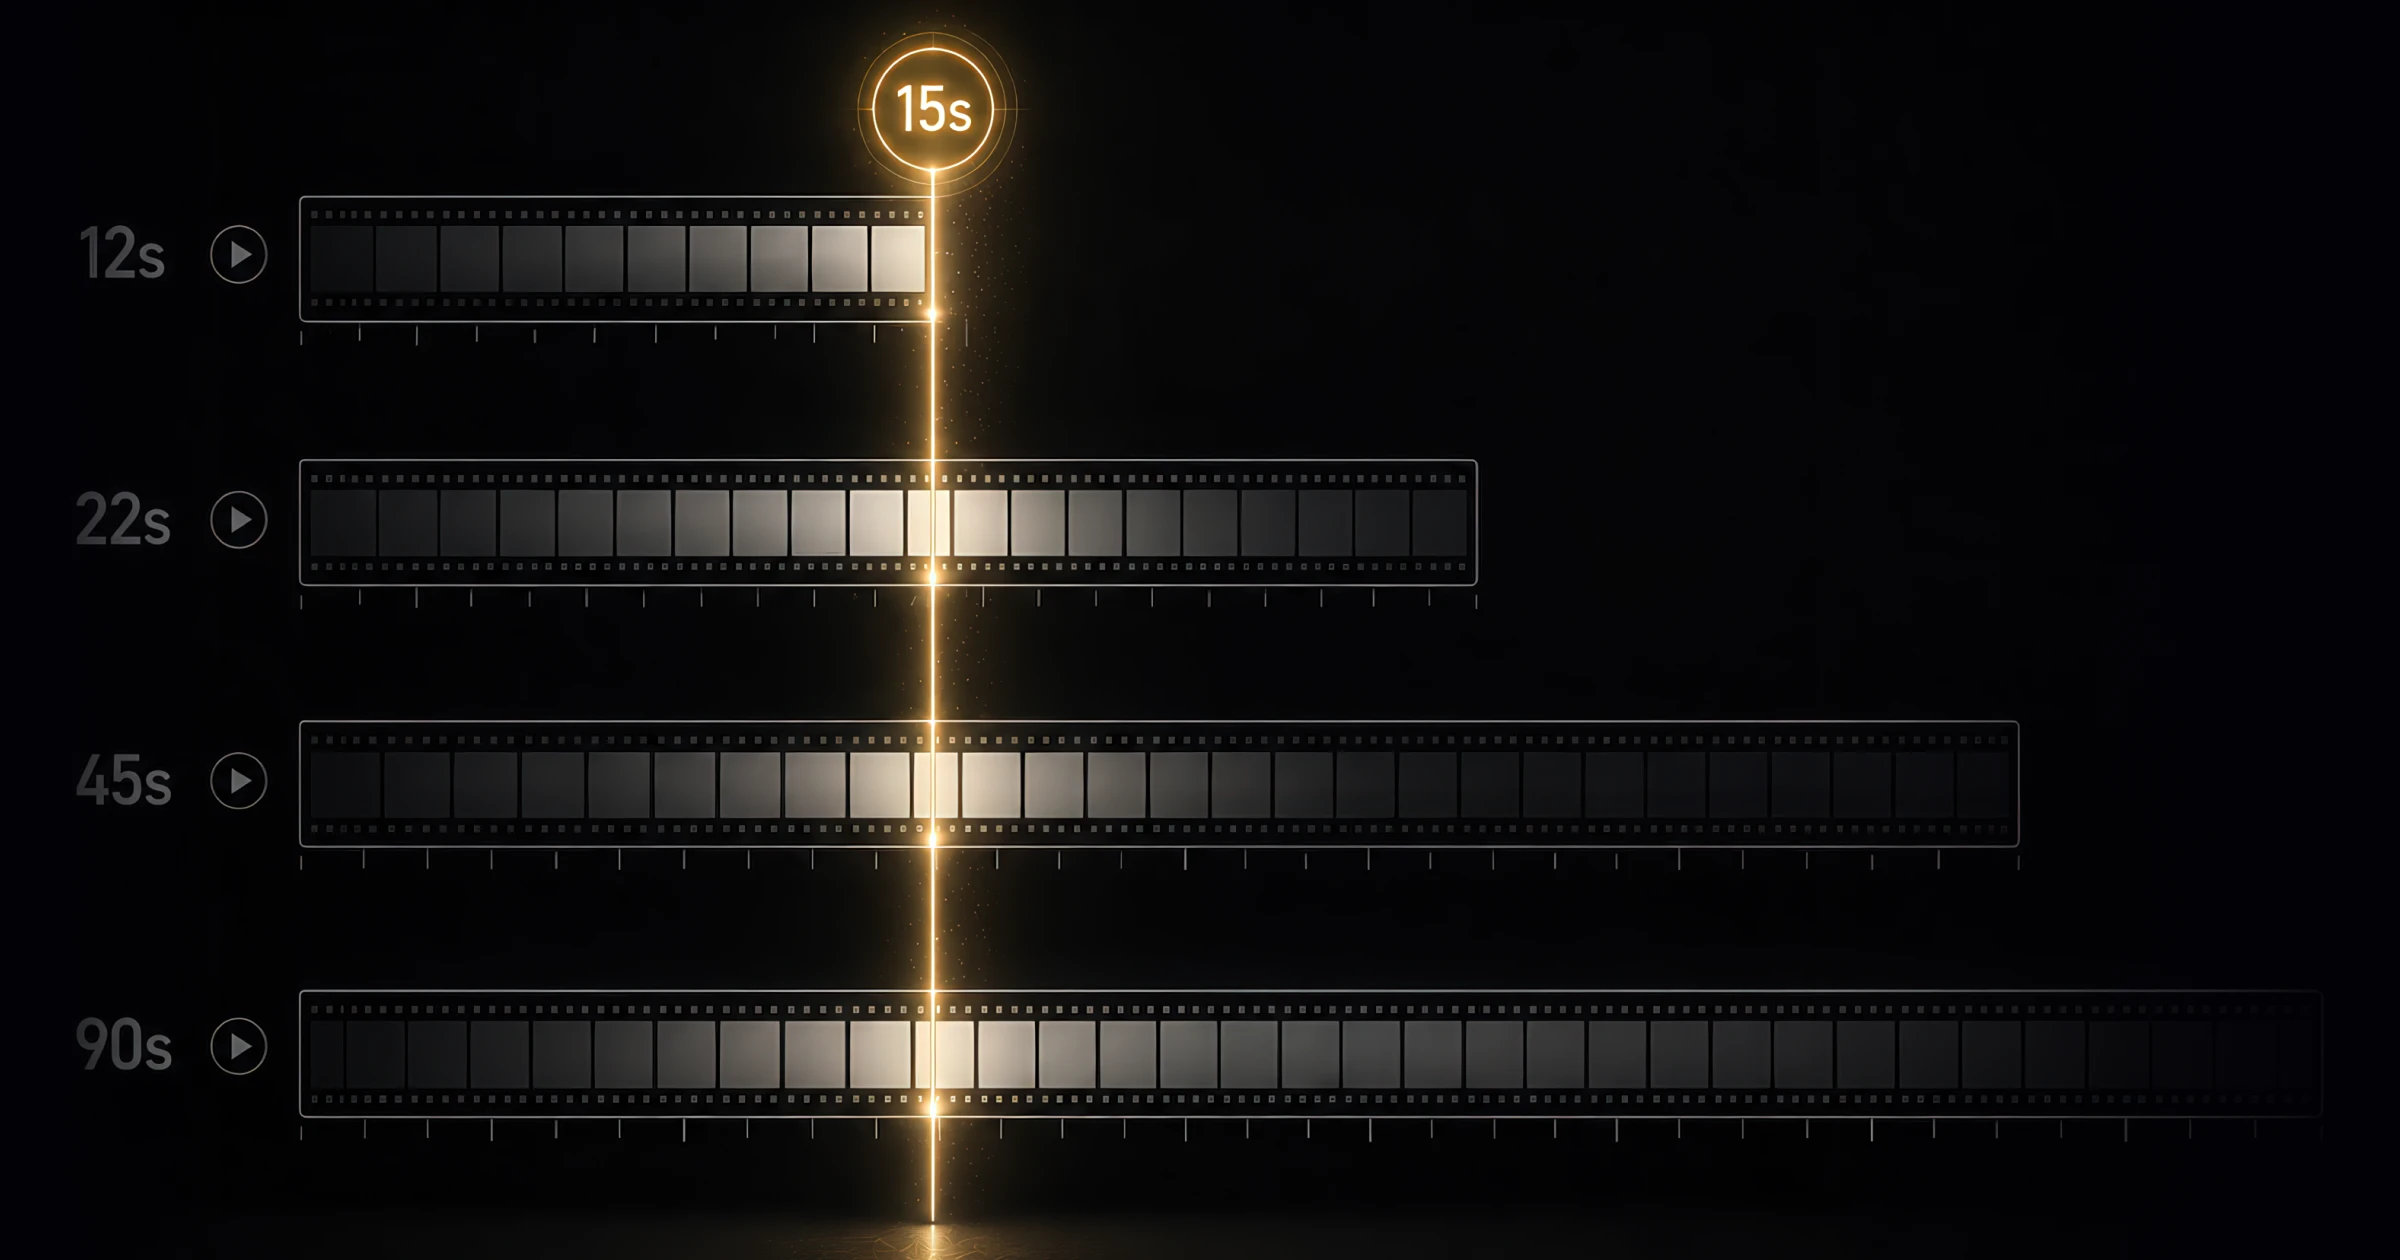
A ThruPlay counts when a viewer watches a video to (for videos under 15 seconds) or reaches of view time (for videos 15 seconds or longer). The threshold is fixed at 15 seconds regardless of video length, which is the single most important thing to understand about the metric: every benchmark below shifts mechanically with video duration relative to that fixed threshold.
The formula is ThruPlay Rate = ThruPlays / Video Plays × 100. Meta also exposes ThruPlay as both a billing event (you can bid for ThruPlay optimization on certain awareness/video objectives) and as a counted metric, and the associated family — Cost Per ThruPlay (CPT), ThruPlay Rate — rounds out the same threshold-based measurement. For the underlying definition see our ThruPlay glossary entry, plug your account rate into the free ThruPlay Rate Benchmark tool, and for the cross-platform context see ThruPlay on TikTok, Meta, and YouTube — are they the same metric?.
Length is the single biggest mover. A 12-second ad mechanically resolves ThruPlay on completion, which is dramatically easier than crossing 15 seconds of a 45-second one. Comparing ThruPlay rate between a 12-second creative and a 60-second creative is structurally meaningless — the threshold isn't the same difficulty. Always segment by length bucket before judging campaign quality.
The two rows below carry inline citations because they're the only Meta-specific ThruPlay numbers we found published with their full segmentation context (audience temperature × placement family × length bucket). Cells dropped from earlier drafts because no public 2024–2026 benchmark report broke them out: 30–60s and 60s+ ThruPlay (operators consistently report "below 10% is poor on cold prospecting", but no source publishes the segmented range).
Sources for the table above: Nielsen's cross-platform short-video completion data (79.4% completion for sub-15s, falling to 51.8% on 30s+ creative) and Affect Group's 18%–28% range for 15–30s ThruPlay.
The "under 15s" row is the row that most often catches operators off-guard. They see an 80% number on a 12-second creative, conclude that creative is exceptional, and try to compare it to the 22% on the agency's 30-second hero spot. The 80% is mechanical — a 12-second video that gets watched to completion is a ThruPlay by Meta's definition, but it is also a completion. The right comparison for a 12-second creative is completion rate against other sub-15s creatives in the same campaign, not its ThruPlay rate against a longer ad's ThruPlay rate. We call this row out explicitly because the published completion numbers (80%+) get conflated with "good ThruPlay rate" — they aren't measuring the same thing.
Format matters because the rendering environment moves attention. Full-screen, swipe-native placements (Reels, Stories) hold viewers through the 15-second threshold at materially higher rates than scrollable feed placements where sound-off-by-default and rapid swipe velocity work against retention. If your campaign is mostly Reels-served, an "above-benchmark" ThruPlay rate may just be placement mix — filter to a single placement before comparing to anything.
Only one cell here survives the source check. Triple Whale's 2025 ad-benchmarks report cites an aggregate Facebook ThruPlay average of ~29% with sub-15s creatives reaching 53.7%, and adlibrary.com's hold-rate reference notes that Reels typically runs 5–10 percentage points higher than Feed at the 15-second mark. We treat that as the citable Reels band.
Cells dropped: Stories, Feed, and in-stream all carry "directionally lower than Reels" comments across the industry, but no source we found publishes a specific 2024–2026 range with the full Meta × placement × audience-temperature × length-bucket segmentation. If you've seen a source we missed, the right move is to email us and we'll add it. The honest read is: if your account is Reels-heavy, compare to the Reels band; if it's mostly Feed or In-stream, compare against your own account's prior-quarter Reels-stripped baseline because no public benchmark is segmented finely enough.
Audience temperature is the second-biggest mover after length. Warm audiences (retargeting, customer lookalikes) recognise the brand, have already opted in to engaging in some way, and clear the 15-second threshold at materially higher rates than cold prospecting traffic. A 35%+ ThruPlay rate on retargeting tells you almost nothing about creative quality; the creative-quality signal lives in cold-audience prospecting.
Two rows survive the source check. Cold prospecting at 15%–25% is the consensus band cited across Affect Group, MHI Growth Engine (DTC-specific), and Dynamoi's 2026 music-vertical guide. Retargeting is expressed in the cited sources as a multiplier on cold rather than a fixed band — adlibrary specifically: retargeting hold/ThruPlay runs 30%–50% higher than cold.
Cells dropped: Lookalike and Custom-audience-of-purchasers both carry industry-consensus framing ("between cold and warm" / "the most-engaged segment") but neither has a public benchmark report with a specific Meta × 15–30s × audience-type range we could cite. Operator experience suggests the lookalike band overlaps cold prospecting (low percentile lookalikes ≈ cold, high percentile lookalikes ≈ warm) — but that's a directional read, not a sourced number.
A 22% ThruPlay rate on a 15–30s prospecting video is healthy. The same 22% on retargeting is mediocre because warm audiences should clear that threshold more easily. An 18% rate on a 45-second prospecting video is actually strong — the threshold mechanic punishes longer videos and 18% on a 45-second creative implies viewers cleared 15 seconds at a rate that out-performs the cohort.
Three rules of thumb anchor the read. First, always compare within the same length bucket — ThruPlay rate is mechanically driven by video duration relative to the 15-second threshold, so comparisons across length cells aren't apples-to-apples. Second, separate prospecting from retargeting — retargeting ThruPlay rates above 35% are normal and tell you nothing about creative quality. Third, pair ThruPlay rate with Video Completion Rate (VCR) — a 60-second video can have a 25% ThruPlay rate (acceptable) and a 3% VCR (terrible); ThruPlay tells you viewers cleared the 15-second mark, VCR tells you whether the closing message and CTA actually got seen.
When accounts improve their ThruPlay rate, most of the lift comes from re-cutting the first 5 seconds — the hook decides whether the viewer sticks long enough to reach the 15-second threshold at all. The remaining lift is split between length-message fit and pacing in seconds 5–15. If your ThruPlay rate is below the benchmark for your length bucket, the opener is where to look first.
The hook problem itself decomposes into four sub-properties of strong openers: visual motion in frame 1 (not a static logo card), a face or product in the first second (not the brand mark), audio that works at zero volume (captions burned in or visually self-explanatory), and a hook that promises specific value rather than a brand slogan. For deeper hook-quality analysis, see Performance Creative and Creative Hooks.
Length-message fit is the second lever. If your message takes 22 seconds to deliver but the audience attention curve drops 60% by second 15, you're paying for ThruPlays that never see the value prop. Two fixes work: cut the video to clear the threshold cleanly (15–18 seconds with the value prop delivered before second 12), or restructure the message so the value prop arrives in the first 10 seconds. Use the Video Drop-off Rate Calculator to visualise where the retention curve drops and identify the exact second where the most viewers leave.
Pacing in seconds 5–15 is the third lever and the most under-used. The 5-second mark is where most viewers decide whether to keep watching — and the pacing of the middle section determines whether they make it to 15. Slow scene changes, long static product shots, and slow voice-over cadence in seconds 5–15 correlate with drop-off; tightening cuts to keep visual novelty through the threshold is the cheapest lever in our experience.
The most useful thing this article can do is keep you from comparing the wrong numbers. Operators routinely cite "thumbstop is around 20%" and then in the next breath quote "ThruPlay should be 20%" — those are two different metrics measured at two different time-on-video thresholds, and they happen to land at the same number for completely unrelated reasons.
The four-metric taxonomy reported in the published references:
3sViews ÷ Impressions). Benchmark band typically 25%–35% on cold prospecting. This is whether the creative survives the swipe-by decision.15sViews ÷ 3sViews or 15sViews ÷ Impressions, depending on author). Benchmark band 15%–25% on cold prospecting at the impression-denominator definition. This is whether the viewer who stuck past the hook stayed for the message.ThruPlays ÷ Video Plays. It overlaps with hold rate but uses Video Plays as the denominator and Meta's specific completion-or-15s definition. Benchmark band is the 18%–28% you see in our table above.100% Views ÷ Impressions). For sub-15s creative this is mechanically close to ThruPlay; for 30s+ creative it diverges sharply (51.8% completion versus a single-digit ThruPlay on prospecting longer formats).The trap operators fall into is treating thumbstop as a proxy for ThruPlay. A 2024 cross-account analysis of 11 brands found thumbstop alone correlated with ROAS at R²≈0.003 — effectively zero. Hook is necessary but not sufficient: ThruPlay (the 15s-survival number) is the one that pairs with revenue, because it's the one that says "the viewer reached the message".
The most common mistake is averaging ThruPlay rate across a campaign that mixes 15-second and 60-second creatives — the length mix-shift dominates the metric. Always segment by length before judging campaign quality.
The second most common mistake is optimising a sales campaign for cheap ThruPlay. ThruPlay is an attention metric, not a conversion metric. Optimising a purchase campaign for cheap ThruPlay typically acquires viewers, not buyers — blended ROAS usually drops 15–25% within two weeks. Use ThruPlay rate as a diagnostic for creative quality and use conversion optimisation for sales objectives.
The third pitfall is treating retargeting ThruPlay as a quality signal. Warm audiences will clear the 15-second threshold at materially higher rates because they recognise the brand and have already engaged. A 40% ThruPlay rate on retargeting tells you nothing about creative quality. The signal lives in the cold-prospecting cell of the benchmark table.
The fourth is ignoring placement mix. Reels and Stories ThruPlay rates run 5–10 points higher than feed because the full-screen format helps retention. If a campaign is mostly Reels-served, an "above-benchmark" rate may just be placement composition.
If ThruPlay rate is below the benchmark for the length bucket and placement, run this diagnostic in order. First, segment by length bucket and re-check — most of the time the apparent under-performance disappears once mix is held constant. Second, segment by placement and re-check — same logic. Third, filter to cold prospecting only — if the campaign-wide ThruPlay rate looked low because retargeting was holding it up artificially, the under-performance lives in cold creative specifically. Fourth, isolate creatives by hook variant and look for one or two creatives bleeding the average — re-cutting the opener on the worst-performing variant is usually the highest-leverage move. Fifth, check the first 5 seconds against the four hook properties (motion, face/product, sound-off legibility, specific value promise) — if any one is missing, fix that one first.
15–30s cold prospecting · Reels/Stories
ThruPlay rate
18%–25%
The single-number anchor most operators should compare against.
Above the public benchmark band
ThruPlay rate
25%+
Dynamoi 2026 reports 25%+ as 'good' and 35%+ as 'great' for cold music-vertical campaigns.
Below the threshold-survival band
ThruPlay rate
< 10%
Retention is collapsing before the 15-second mark — re-cut the first 5 seconds.
Video length | Typical range | Median anchor | What this row actually measures |
|---|---|---|---|
| Under 15s (completion rate, ≠ ThruPlay quality) | ~80% | ~79.4% | Nielsen reports completion rate, which Meta surfaces as ThruPlay for sub-15s creatives. The 79.4% reflects mechanical completion — not creative quality. Compare sub-15s creatives to each other on c... |
| 15–30s (the actual ThruPlay benchmark band) | 18%–28% | ~22% | Cold prospecting on Reels/Stories. Viewers must reach the fixed 15s threshold; this is the band that reflects creative quality. |
Placement | Typical range | What the source actually reports |
|---|---|---|
| Reels | ~5–10pp above Feed (≈20%–30% in the Triple Whale aggregate band) | Full-screen, swipe-native format helps retention through the 15s threshold; the specific +5–10pp delta over Feed is the adlibrary observation, Triple Whale's 29% aggregate is the anchor for the band. |

Audience | Typical range | What it tells you |
|---|---|---|
| Prospecting (cold) | 15%–25% | The benchmark most operators should anchor on for creative quality. Below 10% suggests retention drop-off before the 15s mark — almost always a hook problem. |
| Retargeting (warm) | +30%–50% over the cold rate (≈20%–37% in absolute terms) | Brand recognition inflates ThruPlay; not a creative-quality signal. Expressed as a multiplier on cold because absolute retargeting bands aren't publicly broken out at this level of segmentation. |