Stay Updated
Get the latest insights on creative testing and ad optimization delivered to your inbox.
Get the latest insights on creative testing and ad optimization delivered to your inbox.
Continue reading about this topic with these recommended articles.
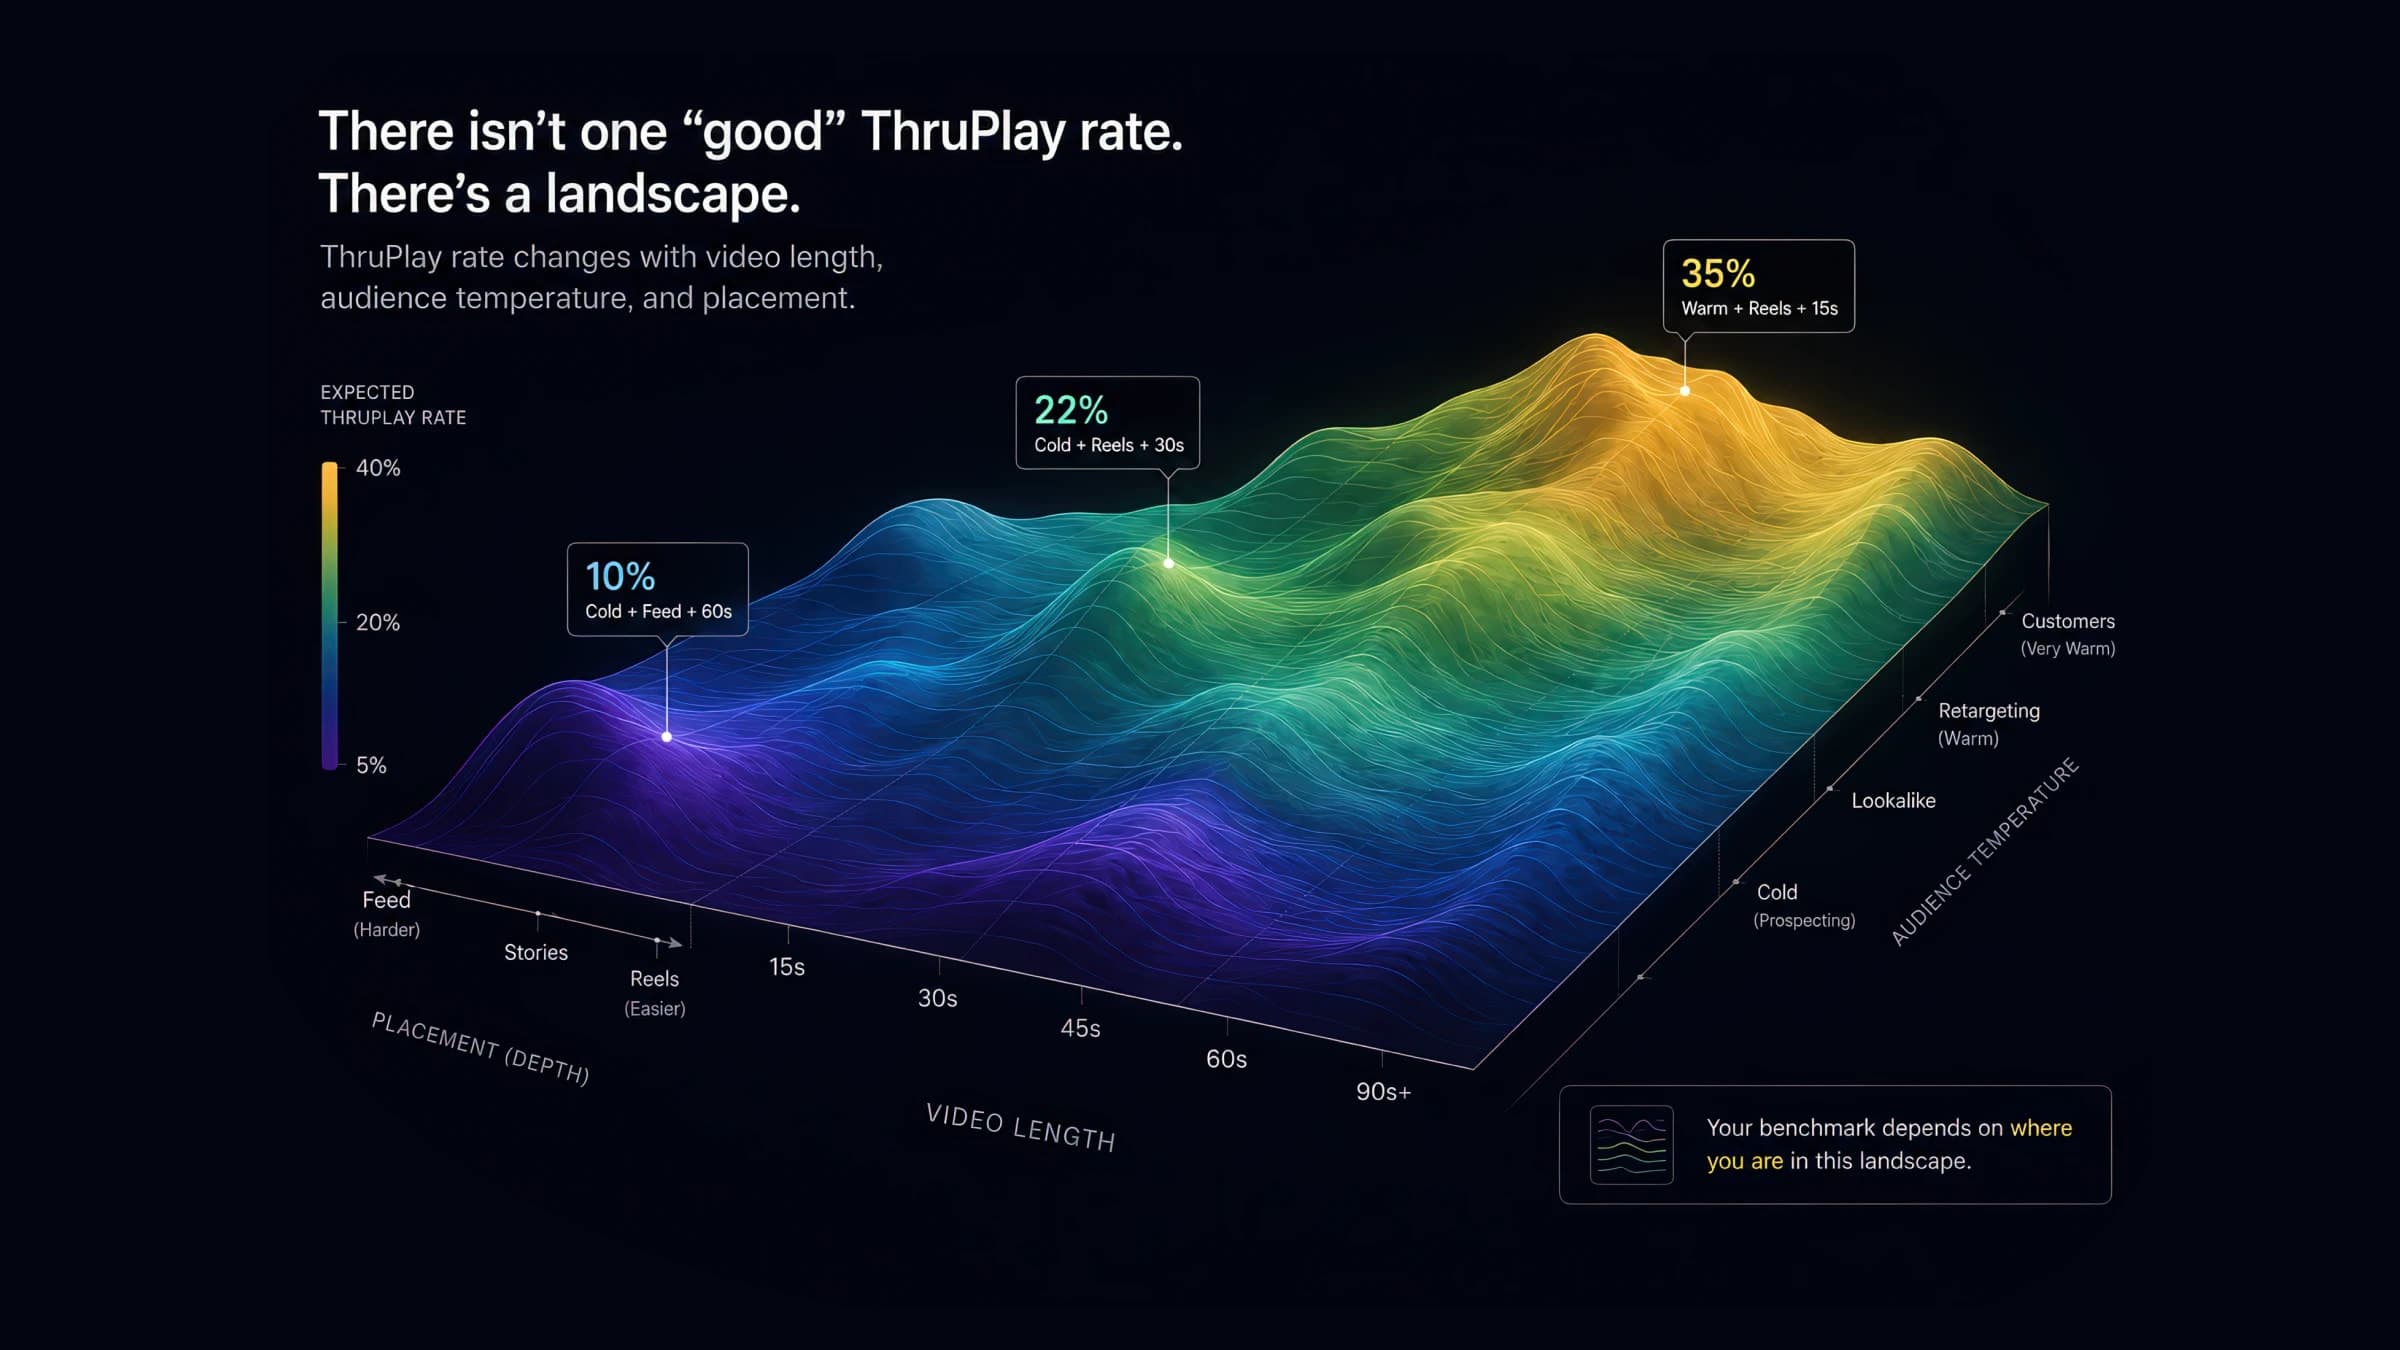
ThruPlay benchmarks shift 10–30 points by video length, placement, and audience temperature. See the full 2026 segmented data — and which number to actually cite.

AI-powered marketing tools

Step-by-step formulas for the three core video-engagement metrics — Video Completion Rate, ThruPlay Rate, and View-Through Rate — with worked examples and the platform-specific quirks that trip up cross-platform comparisons.
AI-powered marketing tools
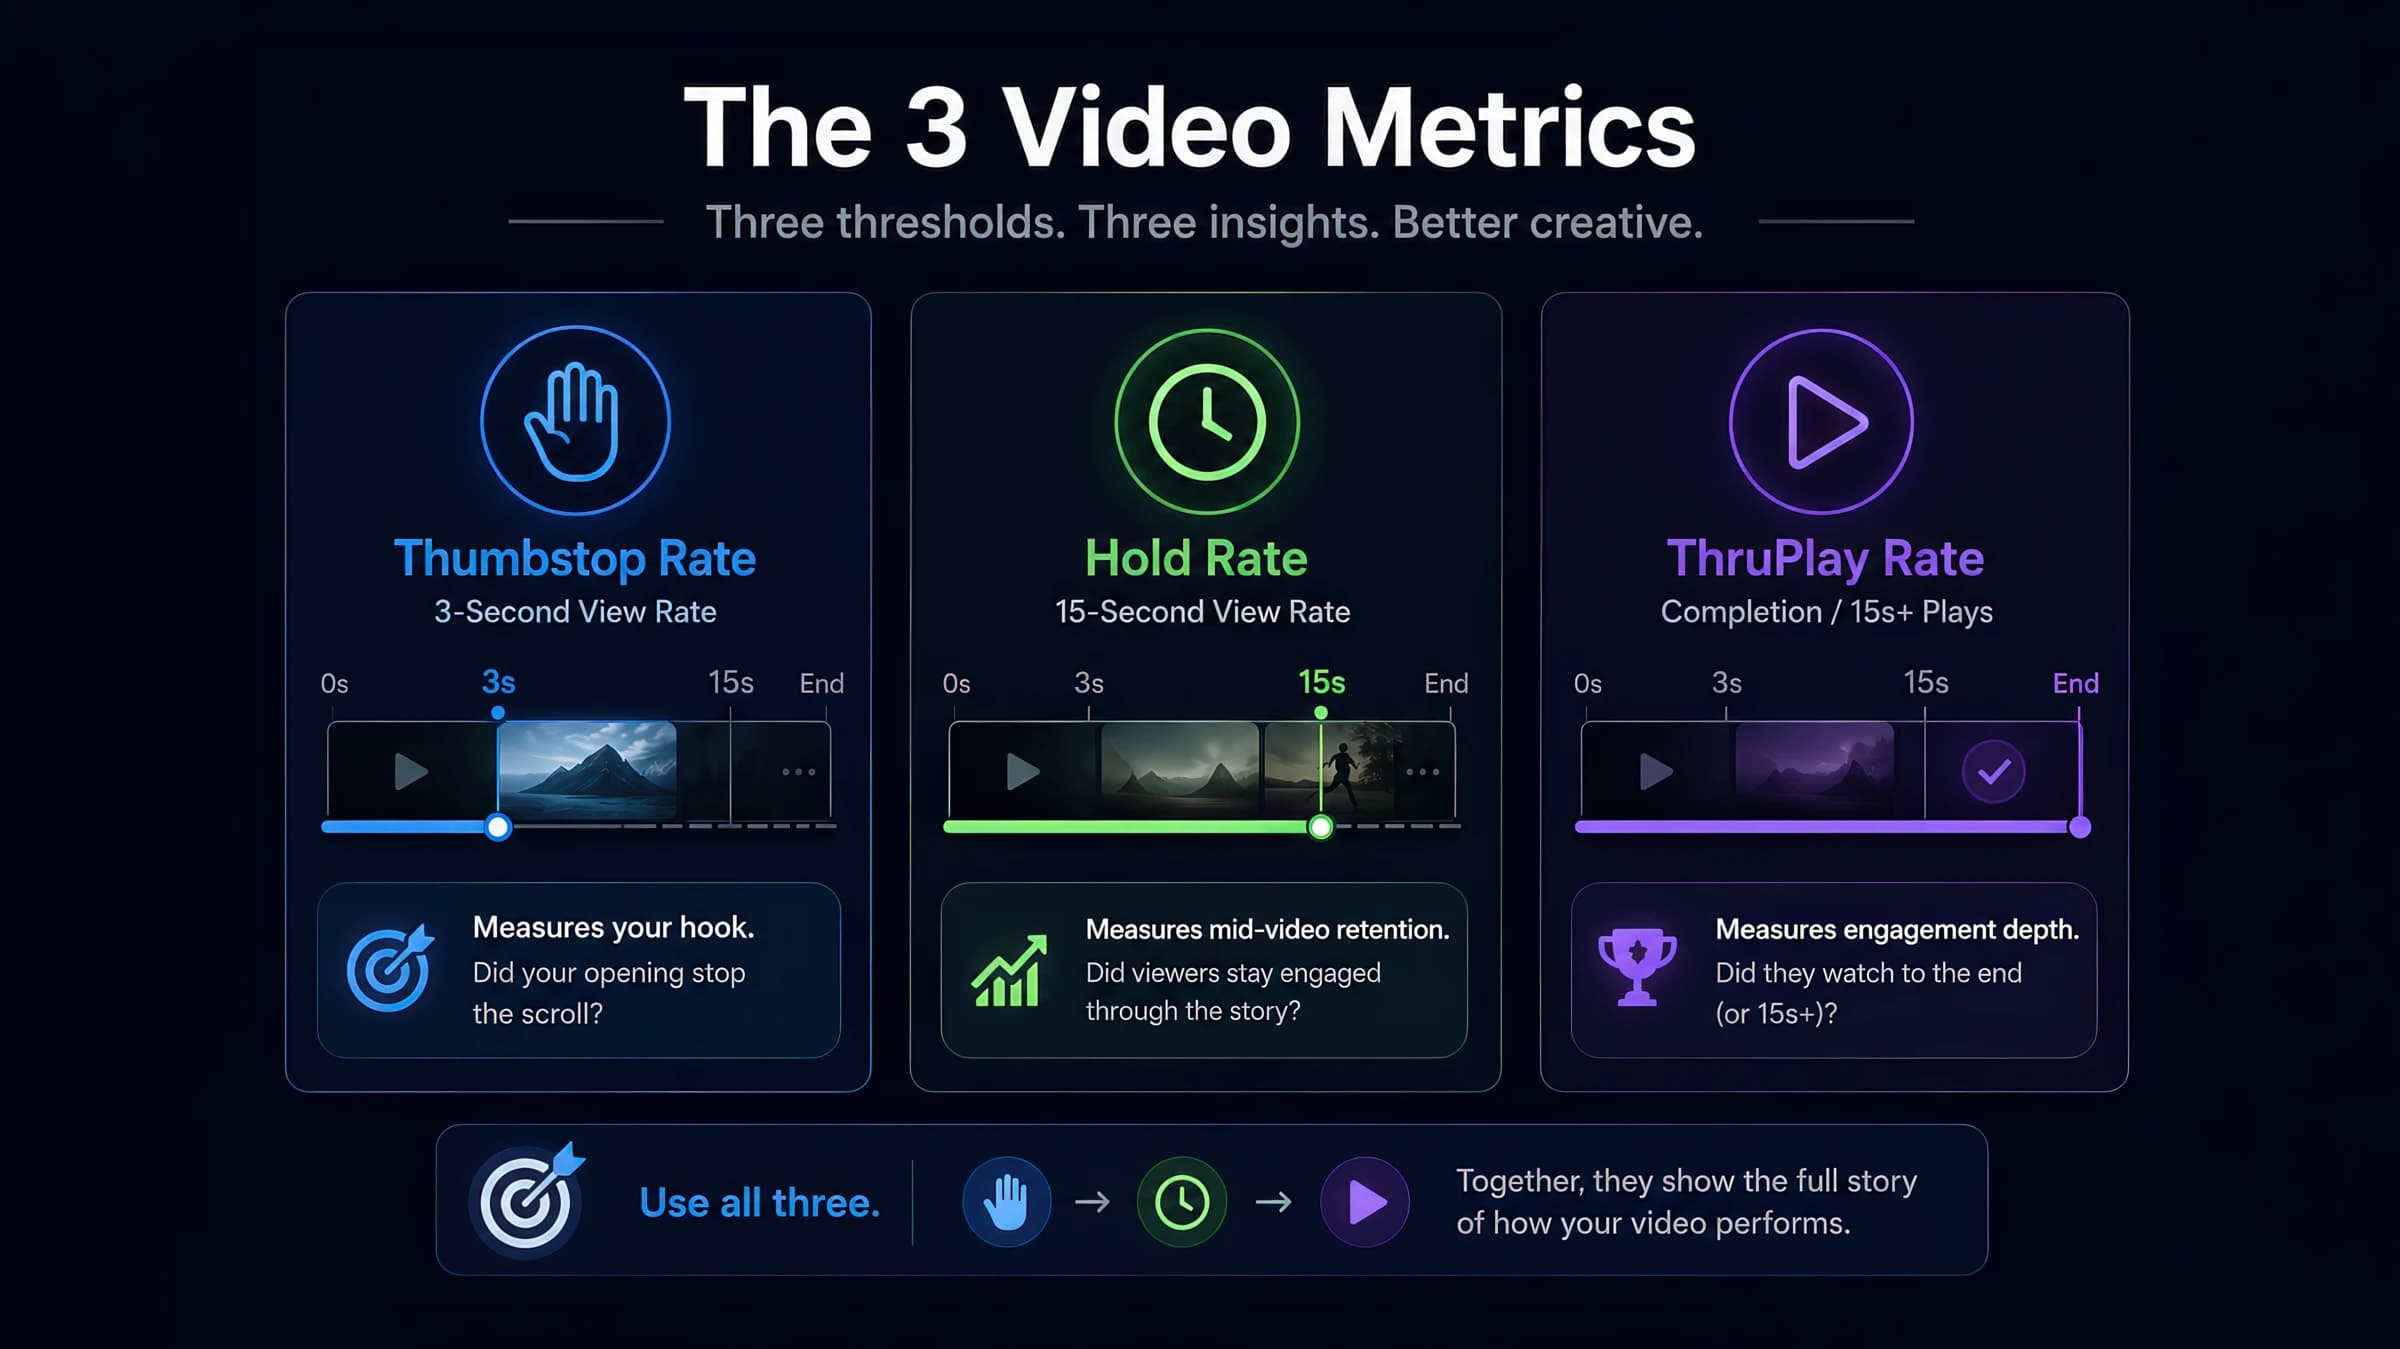
Meta Ads Manager hides the creative diagnostics that matter behind custom columns. This walkthrough shows exactly where to find thumbstop, hold, and ThruPlay — and how to read them without false conclusions.
AI-powered marketing tools
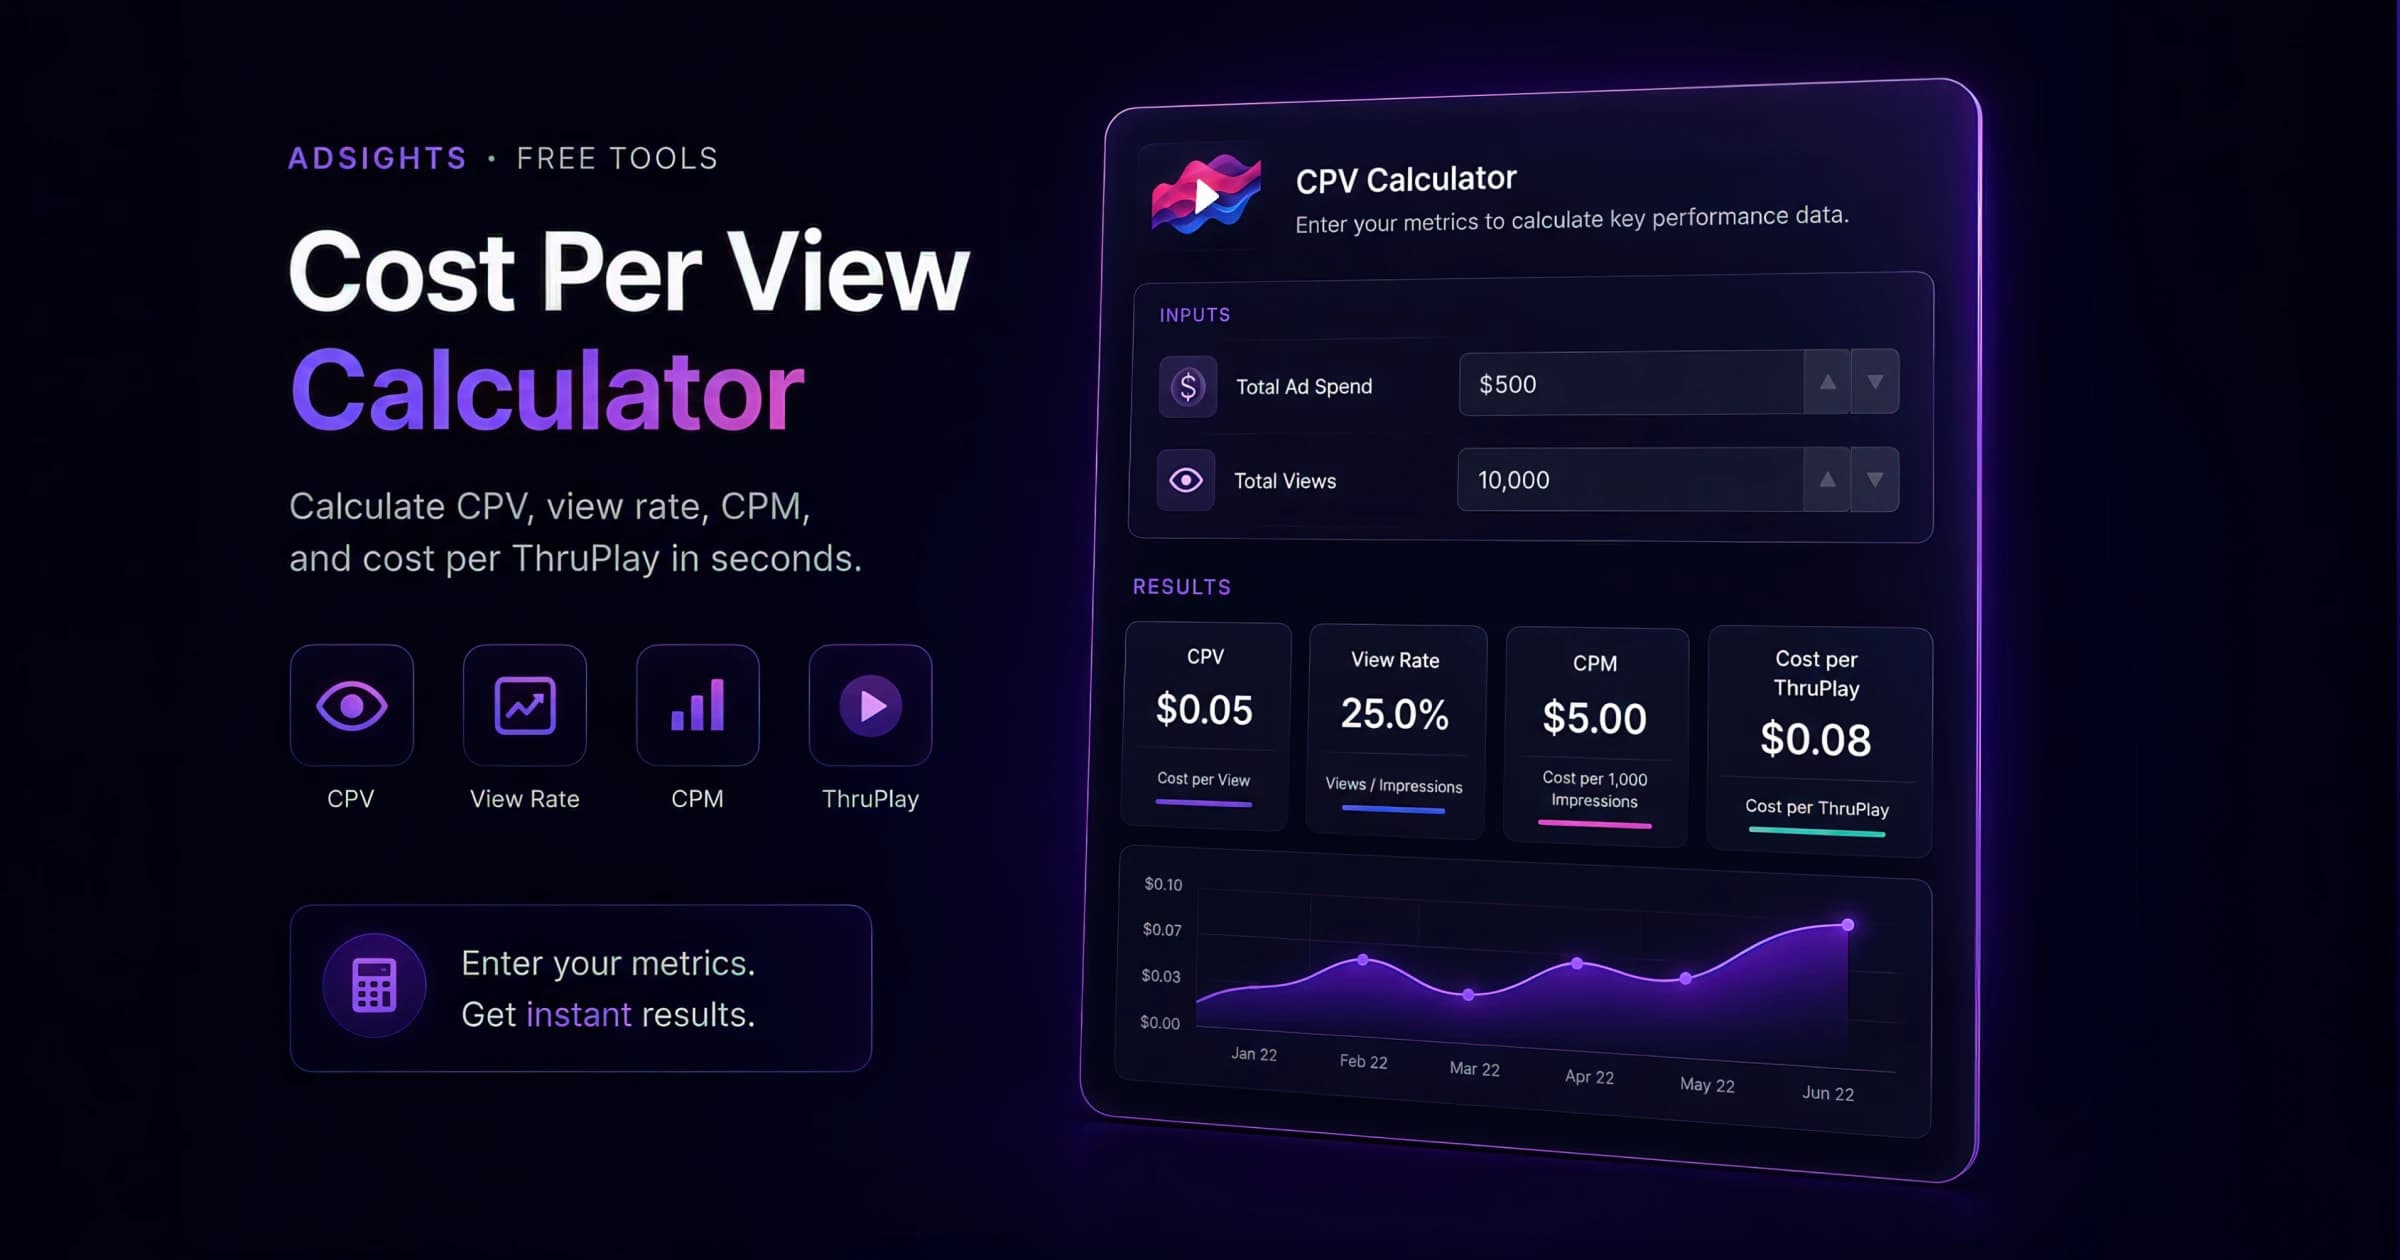
Free CPV calculator for video campaigns. Enter spend and counted views to get cost per view. Add impressions for view rate and CPM, or ThruPlays for cost per ThruPlay — with worked examples, platform view definitions, and 2026 benchmarks for YouTube, Meta, and TikTok.

Grade your ad creatives and get actionable recommendations for improvement. This creative quality grader tool evaluates key elements like visual design, messaging, CTAs, accessibility, and platform optimization to help you create high-performing ads across Facebook, Instagram, TikTok, and YouTube. Get detailed scores and personalized tips to optimize your creative strategy.

Learn how to calculate video completion rate step by step, then run your own numbers: our free VCR calculator shows what percentage of viewers watch to the end, with full retention and drop-off context. Works from YouTube, Vimeo, TikTok, and Facebook analytics data — benchmarked against platform averages.
ThruPlay is Meta's standard video-view event, counted when a viewer watches a video to 15 seconds — or to completion if the video is shorter. It is both a reported metric and a biddable optimization/billing event, and it replaced Meta's retired 10-second video view. ThruPlays ÷ video plays gives the ThruPlay Rate; spend ÷ ThruPlays gives Cost Per ThruPlay. The term is Meta-specific.
Connected TV refers to television content delivered through internet-connected devices and streaming platforms, enabling advanced targeting, measurement, and interactive capabilities for advertisers. This environment combines the impact of traditional TV advertising with digital precision, reaching cord-cutters and streaming audiences through premium, full-screen video experiences.
Thumbstop Rate measures the effectiveness of creative in capturing attention by tracking the percentage of users who stop scrolling to engage with the content in their feed for a meaningful duration, typically 2-6 seconds depending on the platform.
Meta Ads Manager is the comprehensive advertising platform for creating, managing, and analyzing campaigns across Facebook, Instagram, Messenger, and WhatsApp. It provides granular control over campaign objectives, audience targeting, bidding strategies, and creative assets while offering real-time performance metrics and optimization tools. The platform supports diverse ad formats from basic image ads to sophisticated dynamic campaigns, with built-in A/B testing capabilities and automated optimization features.
ThruPlay is a Meta-specific term, but the underlying mechanic — counting a view at a specific threshold — exists differently on TikTok, YouTube, and CTV. Here's how the metrics actually compare and where cross-platform benchmarks break down.
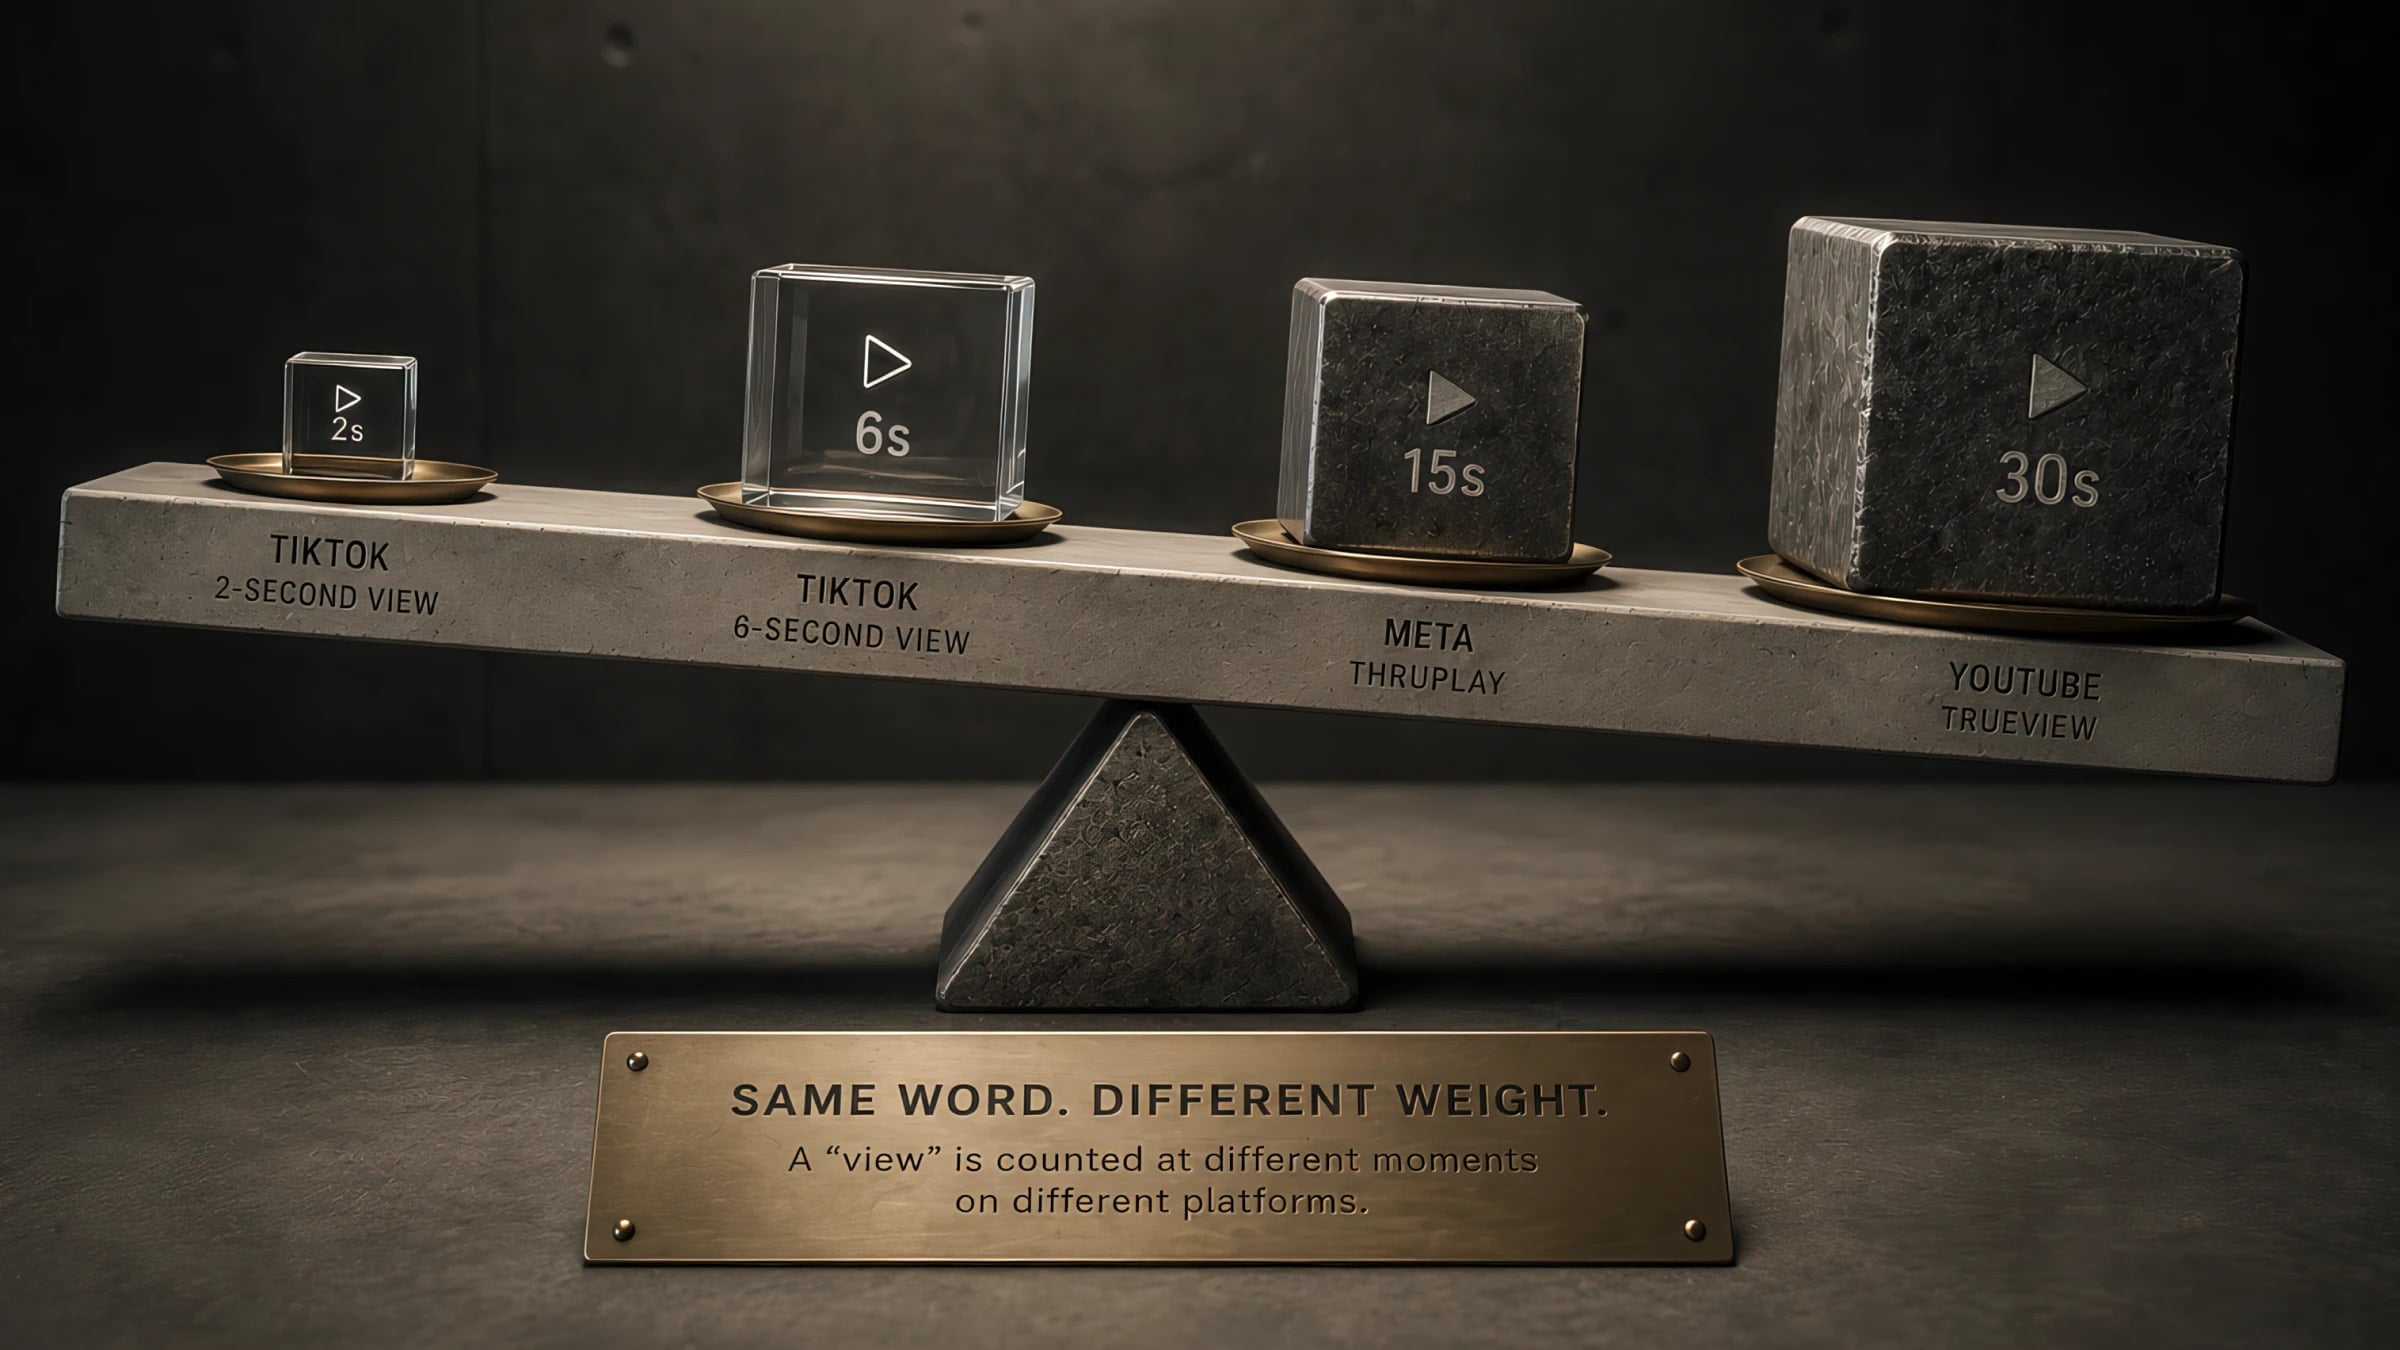
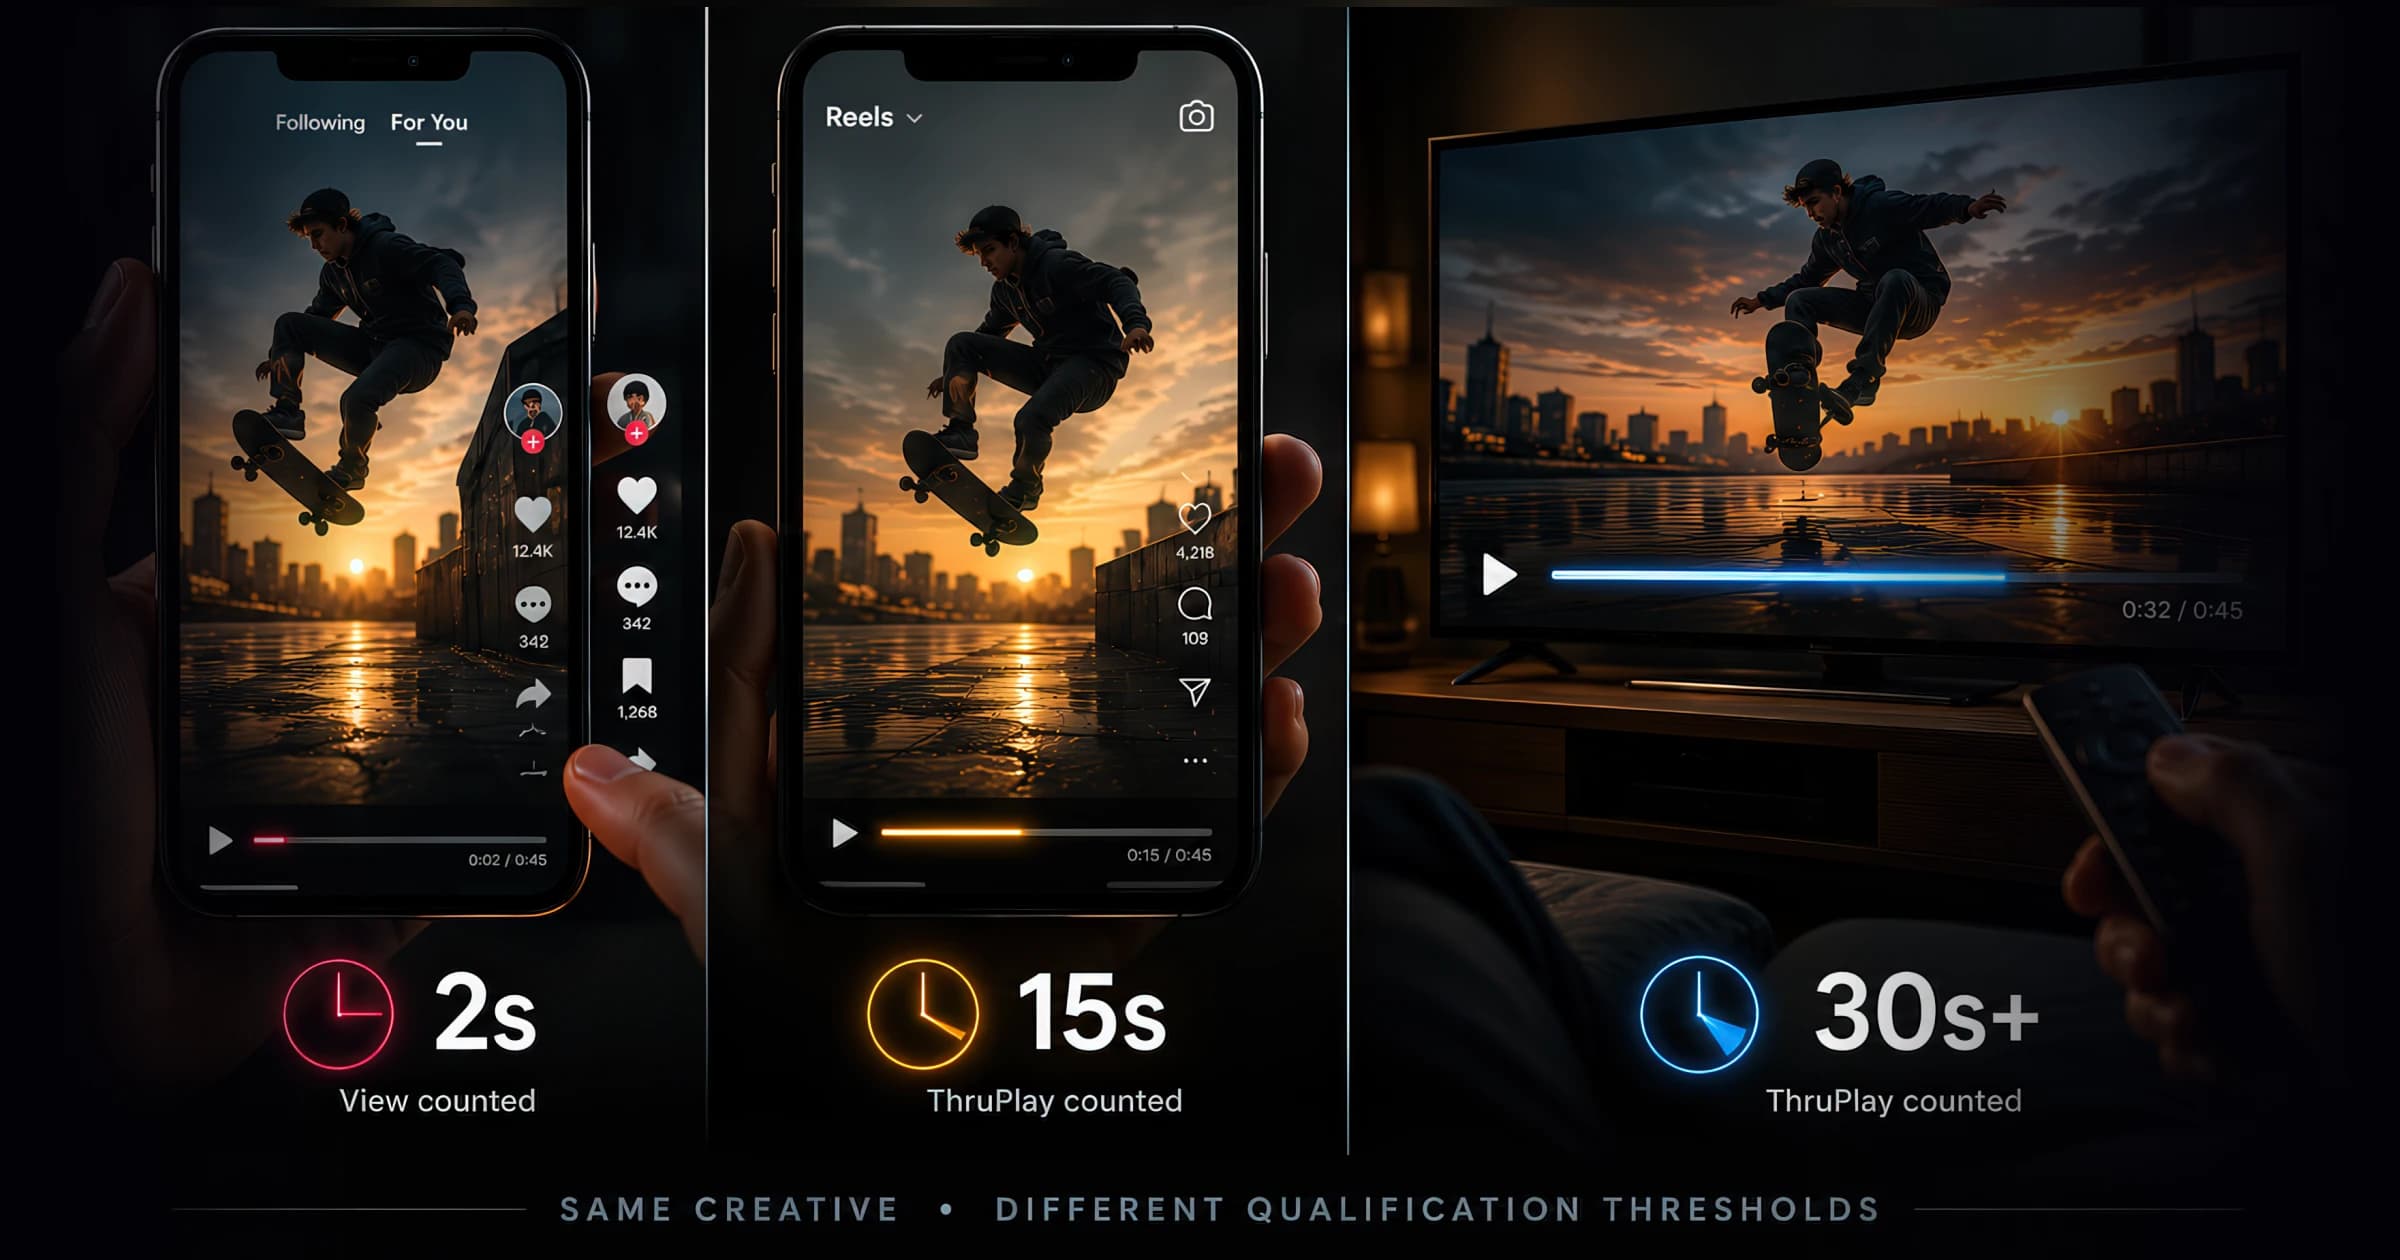
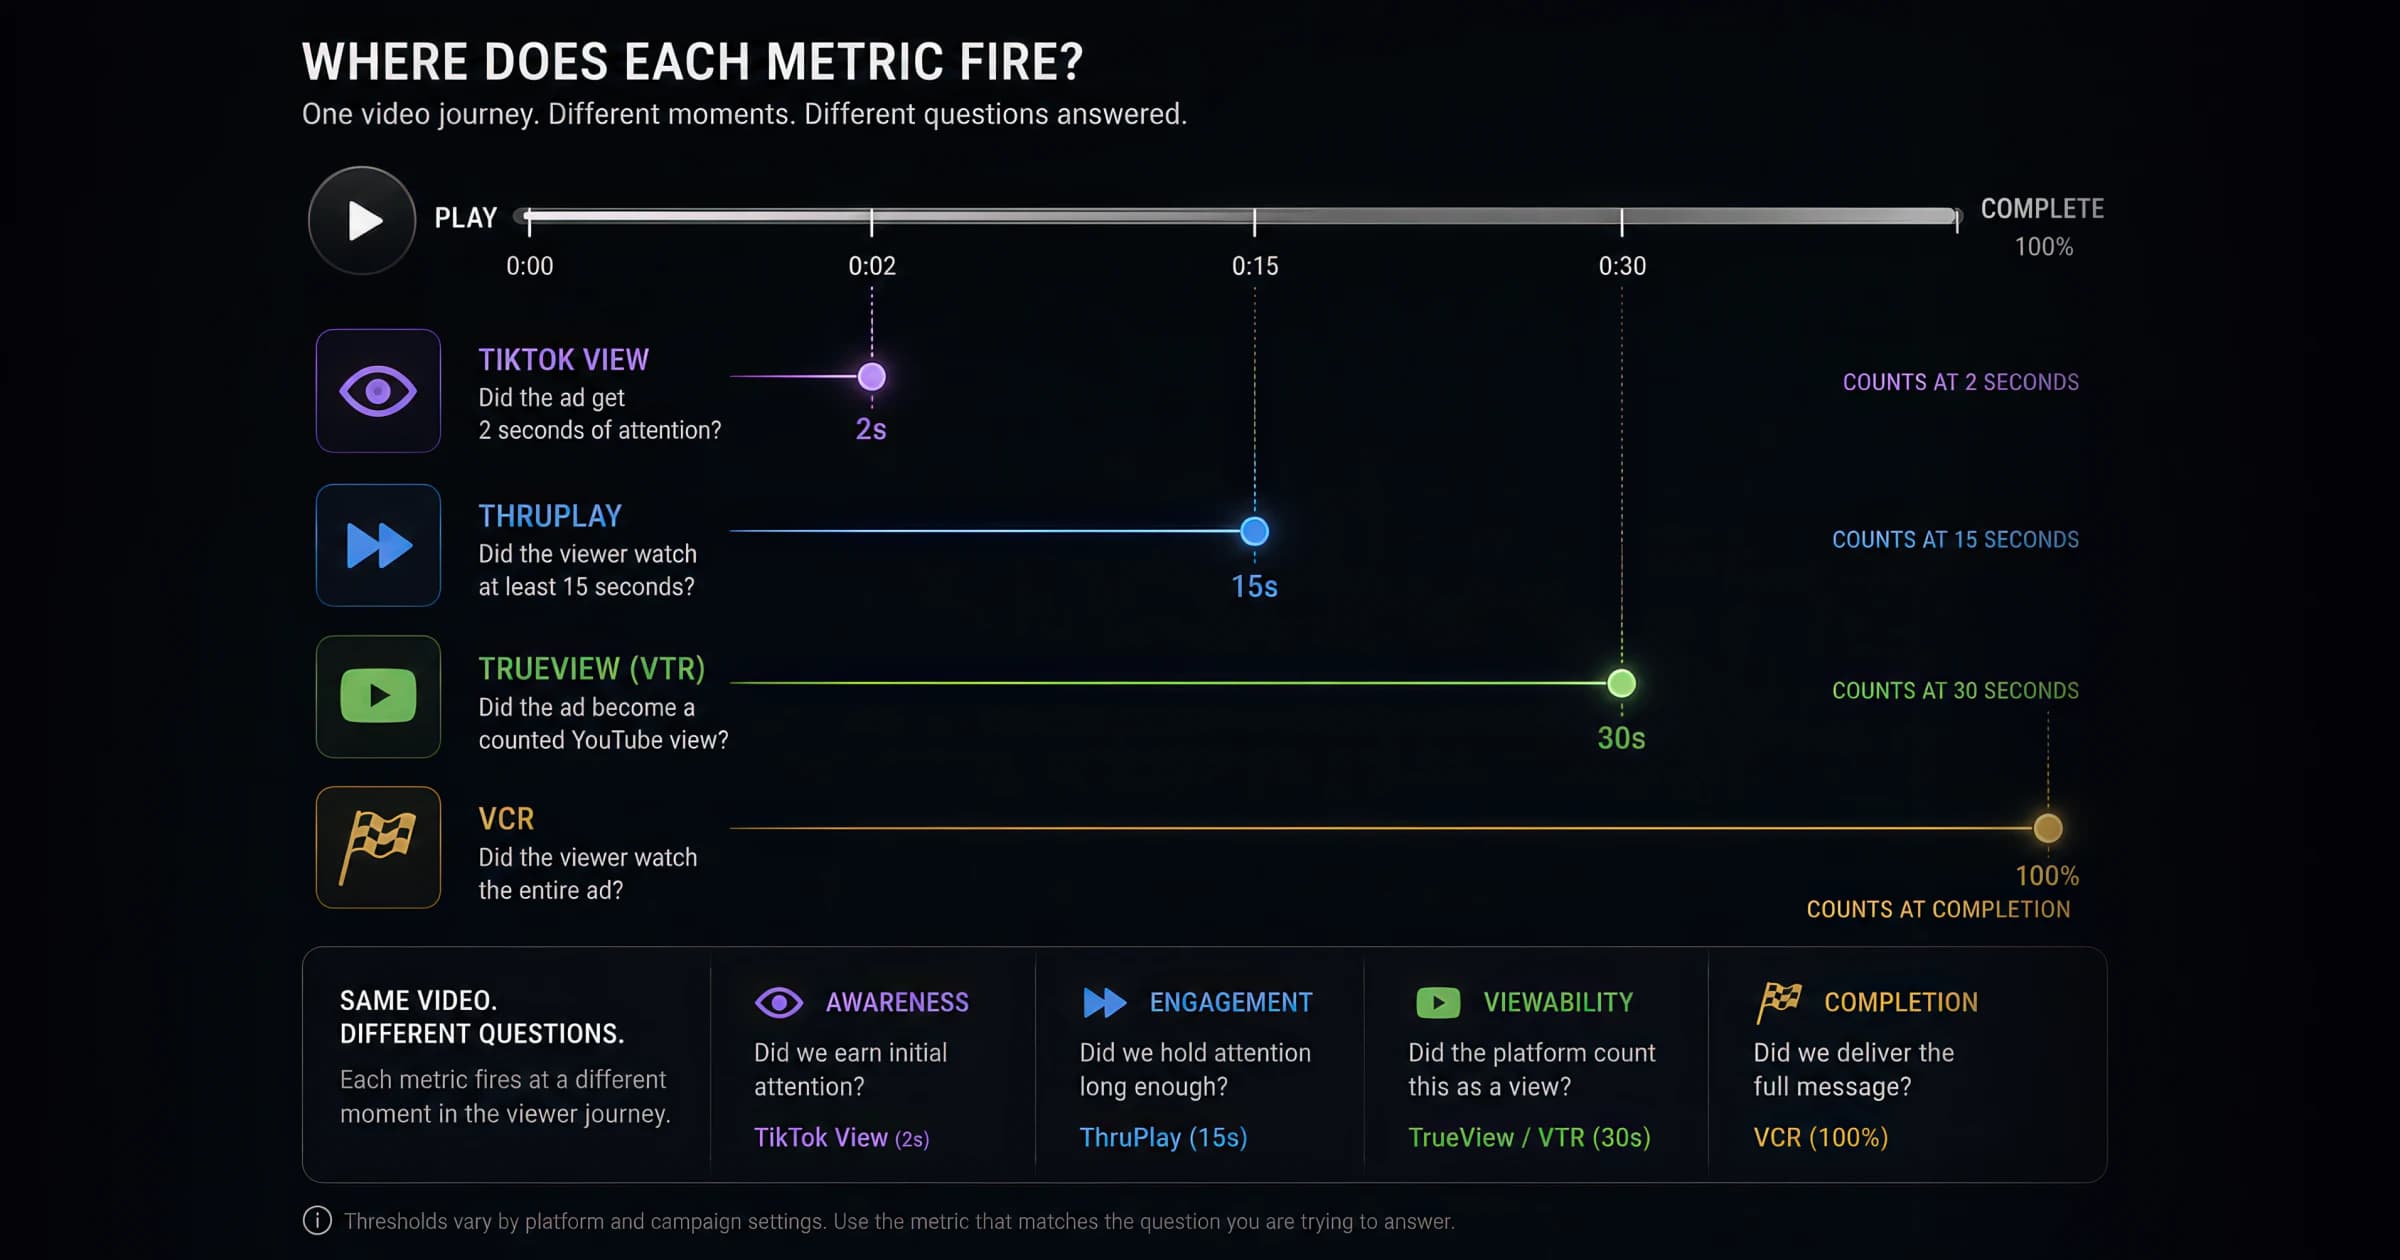
"How does ThruPlay work on TikTok?" gets asked constantly, and it's the wrong question — TikTok doesn't have ThruPlay. ThruPlay is a Meta term for the 15-second-or-completion threshold; TikTok counts views at 2 seconds (plus a 6-second view metric), YouTube TrueView counts at 30 seconds, and CTV reports quartile completion. The mechanic is similar across platforms (count or bill at a view-threshold event) but the threshold differs enough that direct rate comparison is usually misleading.
This guide walks each platform's comparable-to-ThruPlay metric, the benchmark ranges that matter within each platform, and the specific traps that catch operators trying to build cross-channel video reports. For Meta-specific segmented ranges and the three-metric diagnostic stack (thumbstop → hold → ThruPlay), see the Video Creative Metrics Benchmarks 2026 guide and how to read these metrics in Meta Ads Manager.
A ThruPlay counts when a viewer watches the entire video (for videos under 15 seconds) or at least 15 seconds of a video 15 seconds or longer. Meta Ads Manager exposes ThruPlay as both a metric (the count of qualifying views) and as a billing event — you can bid for ThruPlay optimisation on certain awareness and video-view objectives. The associated metrics — Cost per ThruPlay (CPT), ThruPlay Rate — round out the family.
Typical ThruPlay rate ranges are roughly 18%–28% on 15–30-second prospecting creative on Reels and Stories[2]. Below 10% indicates retention drop-off before the threshold, which is almost always a hook problem. Run a specific campaign's number through the ThruPlay Rate Benchmark to place it against the 2026 bands by length and placement. Triple Whale's 2025 aggregate Facebook benchmark reports an average ThruPlay/view-through of 29% across their cohort and notes sub-15s creatives reach 53.7% on the same denominator[3]. The full breakdown by length, placement, and audience temperature lives in the ThruPlay benchmark guide.
The structural quirk operators most often miss is that ThruPlay rate on a sub-15-second video is mechanically inflated because the metric resolves on completion of the entire ad, which is easier than crossing 15 seconds of a longer one. Nielsen's cross-platform completion data puts sub-15s at ~79% completion against 51.8% on 30s+ creative[4] — sub-15s ThruPlay rate is therefore measuring completion, not creative quality. Don't compare ThruPlay rates across length buckets without segmenting first.
TikTok counts a "Video View" at 2 seconds — much earlier than Meta's ThruPlay threshold[5]. There's also a separate 6-second view metric (sometimes called "Focused View") that requires the video to be in the active spotlight (sound on, not scrolling), which is closer in spirit to Meta's ThruPlay but at a different threshold and with stricter attention requirements.
TikTok Ads Manager exposes "Video Views," "2s Video Views," "6s Video Views," and "Video Completion Rate" as separate columns. Typical 2-second view rates run 50%–60% as the acceptable band and 65%+ as a strong cold-prospecting signal[6], with cold-traffic 2s rates running as wide as 60%–80% on the most permissive TikTok inventory[7]. 6-second view rates run 35%–55% in cold prospecting per the same source, which is closer to (but still higher than) Meta ThruPlay rates.
The structural mistake operators make is interpreting TikTok's 70% "view rate" as evidence TikTok is delivering better attention than Meta's 22% ThruPlay rate. The thresholds aren't equivalent. The honest cross-platform comparison would be TikTok's 6-second view rate (35–55%) against Meta's ThruPlay rate (18–28%), or TikTok's completion rate against Meta's VCR. Even those aren't perfectly equivalent — the platforms' attention curves differ — but they're closer.
TikTok's 2-second view definition is also mechanically very permissive. A high 2-second view rate tells almost nothing about creative quality at the message level — every video gets some exposure before the swipe. The signal-bearing metrics on TikTok are 6-second views (does the hook actually land?) and completion rate (does the message deliver?).
A YouTube TrueView "view" counts at 30 seconds of watch time, OR completion of a shorter ad, OR a click[8]. This is the longest threshold of any major video platform — viewers must cross more time before a TrueView counts than a ThruPlay or a TikTok 2-second view.
YouTube reports TrueView views in Google Ads alongside "View Rate" (the share of impressions that became counted views) and quartile completion (25%, 50%, 75%, 100%). Store Growers' 2026 YouTube benchmark report puts TrueView in-stream view rate at ~31.9% average (32% median) and Shorts at 35%–55%[9]. For TrueView on creative 30 seconds or longer, view rate is materially lower because viewers self-select out at the 5-second skip button. The Shorts band is closer to TikTok's pattern than to in-stream TrueView[10].
The quirk to know is that YouTube bumpers (6-second non-skippable) don't generate TrueView views because they can't be skipped — they're billed CPM and reported on completion (which is mechanically near 100%). If your YouTube reporting mixes bumpers with TrueView, the aggregate doesn't reflect either format's quality.
The cross-platform mistake is comparing Meta ThruPlay rate (15s threshold) to YouTube TrueView rate (30s threshold) and treating the rates as equivalent. They aren't. A 22% Meta ThruPlay rate and a 22% YouTube TrueView rate represent different audience commitment — the TrueView took 30+ seconds while the ThruPlay only required 15. The right comparison is rate-against-platform-benchmark, not rate-against-rate.
Connected TV and Over-The-Top video inventory is almost always non-skippable, so the relevant metric isn't a threshold view rate — it's quartile completion[11]. CTV reports completion as the share of impressions that reached each of 25%, 50%, 75%, 100% of the video. Completion rates are mechanically very high — typically 90%+ for 100% completion, and AdWave's Q3 2025 CTV benchmark puts Peacock/Tubi/Pluto-class non-skippable inventory at ~97.2% completion[12] — because viewers can't drop out before completion without walking away from the TV.
The structural mistake on CTV is interpreting a 95% VCR as evidence of strong creative. It's a mechanical artefact of non-skippable inventory. The right CTV signal is the attention-adjusted variant: target viewable rate (TVR), attentive-viewer metrics from third-party measurement, or completed views against actual time-in-room as measured by ACR-based panels.
The table below summarises each platform's comparable-to-ThruPlay metric, the threshold, and the typical range for prospecting creative.
If a reporting dashboard shows a single "Video View Rate" column averaging across Meta, TikTok, and YouTube, the number is meaningless — the report is averaging metrics with materially different thresholds. Two fixes work in practice.
Show three columns, one per platform, labelled with the metric name (Meta ThruPlay rate, TikTok 6-second view rate, YouTube TrueView view rate). Same row per creative; readers can compare each rate against its own platform's benchmark instead of against the cross-platform average.
Use VCR as the cross-platform metric when you only have room for one column. VCR is consistent across platforms because the threshold (100% completion) is the same everywhere. Pair the VCR column with a length-bucket filter so the numbers are honestly comparable — a 30-second creative's VCR on TikTok isn't directly comparable to a 60-second creative's VCR on YouTube unless you've held length constant.
The third operational discipline is to separate platform-attribution noise from creative quality. A creative that under-performs on YouTube but over-performs on Meta isn't necessarily a bad YouTube creative — it might be that YouTube's 30-second threshold is unforgiving for that creative's length-message fit, or that the placement composition is skewing towards low-attention inventory. Filter to a single placement and a single length bucket on each platform before drawing creative-quality conclusions.
The takeaway for cross-channel video reporting is that direct rate comparison across platforms is almost always wrong, but each platform's metric is useful within its own benchmark range. Build per-platform attention dashboards (with platform-appropriate thresholds), report creative quality against platform-specific benchmarks, and use VCR as the cross-platform anchor when comparison is unavoidable.
15s OR completion
View threshold
15s
Cold-prospecting benchmark 18%–28% on 15–30s Reels/Stories creative.
6s active view
View threshold
6s
Cold-prospecting band 35%–55%; the rate closest to Meta's ThruPlay in spirit.
30s OR completion OR click
View threshold
30s
In-stream view rate averages ~32% per Store Growers; Shorts run 35%–55%.
Non-skippable
Completion threshold
100%
Completion rate mechanically ~95%+ on non-skippable inventory.
Platform | Metric | Threshold | Typical range (cold) |
|---|---|---|---|
| Meta | ThruPlay Rate | 15s OR completion | 18%–28% (15–30s Reels/Stories per Affect Group; 29% aggregate per Triple Whale) |
| TikTok | 2s Video View Rate | 2s | 50%–80% (50–60% acceptable per Shortimize; 60–80% on permissive cold inventory per Growth-onomics) |
| TikTok |
| 6s Focused View Rate |
| 6s active view |
| 35%–55% (Growth-onomics cold prospecting) |
| YouTube (TrueView in-stream) | View Rate | 30s OR completion OR click | ~32% median (Store Growers 2026) |
| YouTube (Shorts) | View Rate | 30s OR completion | 35%–55% (Store Growers 2026) |
| CTV / OTT | VCR (100% completion) | 100% of video | 95%+ on non-skippable (Innovid 2024–2025; AdWave Q3 2025 ~97.2%) |

