
Guide
Benchmarks & how to read your result
How to read and act on your result — research-backed context with linked sources for every benchmark cited.
The VCR formula
VCR = (Complete Views ÷ Video Starts) × 100
- Complete Views — views that reached 100% of the video's duration
- Video Starts — views that began playing (some platforms report against impressions or 3-second views instead — see step 2 below)
If 1,000 people start your video and 250 watch to the end, VCR = 250 ÷ 1,000 × 100 = 25%.
How to calculate video completion rate, step by step
- Pull the two inputs from your platform report. You need complete views (watches to 100%) and total plays. On Meta these are "Video plays" and "Video plays at 100%"; on YouTube use video plays and the 100% quartile from audience retention; on TikTok use video views and "Watched full video".
- Check the denominator definition. Meta autoplays in feed, so plays sit close to impressions; YouTube reports quartiles against plays; TikTok counts a play almost immediately. Never mix a completions number from one report with a plays number from another.
- Check the numerator threshold. VCR uses 100% completions. Meta's ThruPlay (15-second watch) is a billing metric, not a completion metric — using it in the numerator inflates VCR (see the worked example).
- Divide completions by plays and multiply by 100. That's your VCR.
- Benchmark against the same platform, placement, and length band. A 60-second skippable pre-roll and a 12-second Reel are different games — see the table below.
Worked example 1: 30-second Meta ad
- Impressions with a 3-second view: 50,000
- ThruPlay (15-second watch): 7,500 — a separate Meta billing metric, not VCR
- Views to 100% completion: 5,000
- Completion rate = 5,000 ÷ 50,000 × 100 = 10%
For a 30-second creative, 10% completion is below the Meta average for that length (~20–25% for prospecting). ThruPlay (15%) can look healthier than true end-to-end completion — always use 100% completions in the VCR numerator. The retention curve typically shows the steepest drop in the first 3 seconds — hook problem, not mid-roll problem.
Worked example 2: 30-second YouTube skippable in-stream ad
- Video plays: 80,000
- Views reaching the 100% quartile (audience retention report): 16,000
- Completion rate = 16,000 ÷ 80,000 × 100 = 20%
20% sits inside the normal 15–30% band for skippable 30s+ in-stream, where most viewers skip at second 5. Note the trap: YouTube counts a billable TrueView view at 30 seconds or completion — that is a payment threshold, not your VCR numerator. Quartile reporting is where completion comes from.
Video completion rate benchmarks by placement & format
Honest, source-attributed ranges (aligned with the AdSights glossary benchmark set):
CTV / OTT (15s & 30s, non-skippable)
- Typical range
- 94–98%
- Median
- 96%
YouTube bumpers (6s, non-skippable)
- Typical range
- 90–95%
- Median
- 92%
Meta Reels / short-form under 15s
- Typical range
- 75–100%
- Median
- ~85%
TikTok in-feed (21–34s)
- Typical range
- 55–70%
- Median
- 62%
Meta Reels / Stories (15–30s)
- Typical range
- 40–65%
- Median
- 50%
- Source
- Sprout Social 2025That Random Agency 2026
YouTube TrueView in-stream (30s+, skippable)
- Typical range
- 15–30%
- Median
- 20%
| Placement / format | Typical range | Median | Source |
|---|---|---|---|
| CTV / OTT (15s & 30s, non-skippable) | 94–98% | 96% | Innovid Global Benchmarks 2024 / Adwave Q3 2025 |
| YouTube bumpers (6s, non-skippable) | 90–95% | 92% | OwlClaw YouTube Benchmarks 2026 |
| Meta Reels / short-form under 15s | 75–100% | ~85% | Sprout Social 2025Socialinsider 2025 |
| TikTok in-feed (21–34s) | 55–70% | 62% | OpusClip retention study 2025WebFX |
| Meta Reels / Stories (15–30s) | 40–65% | 50% | Sprout Social 2025That Random Agency 2026 |
| YouTube TrueView in-stream (30s+, skippable) | 15–30% | 20% | Store Growers 2026Mutesix 2025 |
Long-form skippable (60s+) drops further, to roughly 2–10%. As a rule of thumb on skippable formats, every additional 15 seconds of length costs ~15–20 points of completion.
VCR vs ThruPlay vs view-through rate
Video completion rate (VCR)
- Definition
- % of viewers who watch to 100%
- Typical use
- Organic + paid creative QA
ThruPlay (Meta)
- Definition
- 15s+ watch or full video if shorter
- Typical use
- Meta billing and optimization
View-through rate (VTR)
- Definition
- Completed views ÷ impressions (ads)
- Typical use
- Display/video ad reporting
Hook rate
- Definition
- % watching past 3 seconds
- Typical use
- Short-form creative testing
| Term | Definition | Typical use |
|---|---|---|
| Video completion rate (VCR) | % of viewers who watch to 100% | Organic + paid creative QA |
| ThruPlay (Meta) | 15s+ watch or full video if shorter | Meta billing and optimization |
| View-through rate (VTR) | Completed views ÷ impressions (ads) | Display/video ad reporting |
| Hook rate | % watching past 3 seconds | Short-form creative testing |
See ThruPlay rate in the glossary for Meta-specific billing rules. Compare your completion rate against platform norms with the ThruPlay Rate Benchmark analyzer, and read Hold Rate vs ThruPlay Rate when diagnosing whether the hook or mid-roll is the bottleneck.
Common mistakes
- Mixing denominators — a VCR computed against 3-second views will always beat one computed against impressions; state the denominator when you report the number.
- Comparing completion across different video lengths — a 60s ad will always score lower than a 15s cut.
- Using ThruPlay or impression-based VTR as completion rate — thresholds and denominators differ.
- Ignoring the first 3 seconds — most drop-off happens before the hook lands.
- Benchmarking organic YouTube against paid Meta — different viewer intent.
- Optimizing for completion alone — a 5s loop can score 80% but drive zero conversions.
How to use this calculator
- Select your platform (YouTube, Meta, TikTok, etc.) for length-appropriate benchmarks.
- Enter retention at key breakpoints from your analytics export (or total views + completions).
- Read completion rate and the retention curve — identify the steepest drop segment.
- Compare to the platform benchmark row for your video length.
- Use the Video Drop-off Calculator for deeper segment analysis.
How to improve video completion rate
- Front-load the hook — value proposition in the first 2 seconds.
- Match length to placement — 15s for feed, 30s max for cold prospecting.
- Cut dead air — pattern interrupts every 3–5 seconds on social.
- Caption everything — 80%+ watch muted on feed.
- Test the thumbnail/first frame — it sets completion before play starts.
- Retarget viewers who hit 50%+ — they are your warm audience.
Methodology & sources
Completion rate benchmarks vary by length and placement — never compare a 60s YouTube pre-roll to a 15s Reels hook. VCR uses 100% completions in the numerator; ThruPlay (Meta) is a separate 15-second billing threshold. The benchmark table above mirrors the source-attributed ranges maintained in the AdSights glossary.
Meta Business Help Center — About ThruPlay
Official ThruPlay definition (15s or full video)
In-stream video completion norms
Paid social VCR and hook-rate composites
Sprout Social Video Benchmarks
Organic vs paid completion context
See also Video completion rate (VCR) and ThruPlay rate in the glossary
Video Completion Rate Calculator: How to Calculate VCR
Learn how to calculate video completion rate step by step, then run your own numbers: our free VCR calculator shows what percentage of viewers watch to the end, with full retention and drop-off context. Works from YouTube, Vimeo, TikTok, and Facebook analytics data — benchmarked against platform averages.
Free Calculator
No sign up required. Use this calculator as much as you need.
Stop calculating by hand
Want AI to track this across every creative variant — and tie it back to ROAS automatically? That’s what AdSights does.
Request early accessRelated Calculators

Video Retention & Drop-Off Calculator
Analyze audience drop-off and retention to find exactly where viewers stop watching your videos. Works for YouTube, Vimeo, TikTok, and Facebook analytics data.

CPA Calculator
Free CPA calculator: realized cost per acquisition from spend and conversions, funnel CPA from CPC or CPM × CTR × CVR, break-even CPA from margin, target CAC from LTV, and target CPA from ROAS — with cited 2026 lead-CPL and ecommerce-purchase bands. CSV export. No sign-up.

CPM Calculator
Calculate Cost Per Mille (CPM) and analyze advertising campaign performance with precision. Get comprehensive insights on media buying efficiency, budget optimization, and campaign ROI analysis.
Related Analyzers
Paid Social Benchmarks
Enter your CPM, CPC, or CTR and see how it compares to current published benchmarks for Meta, TikTok, LinkedIn, and YouTube — segmented by campaign objective where the source splits them. Free, no login, every figure cited with source and year.
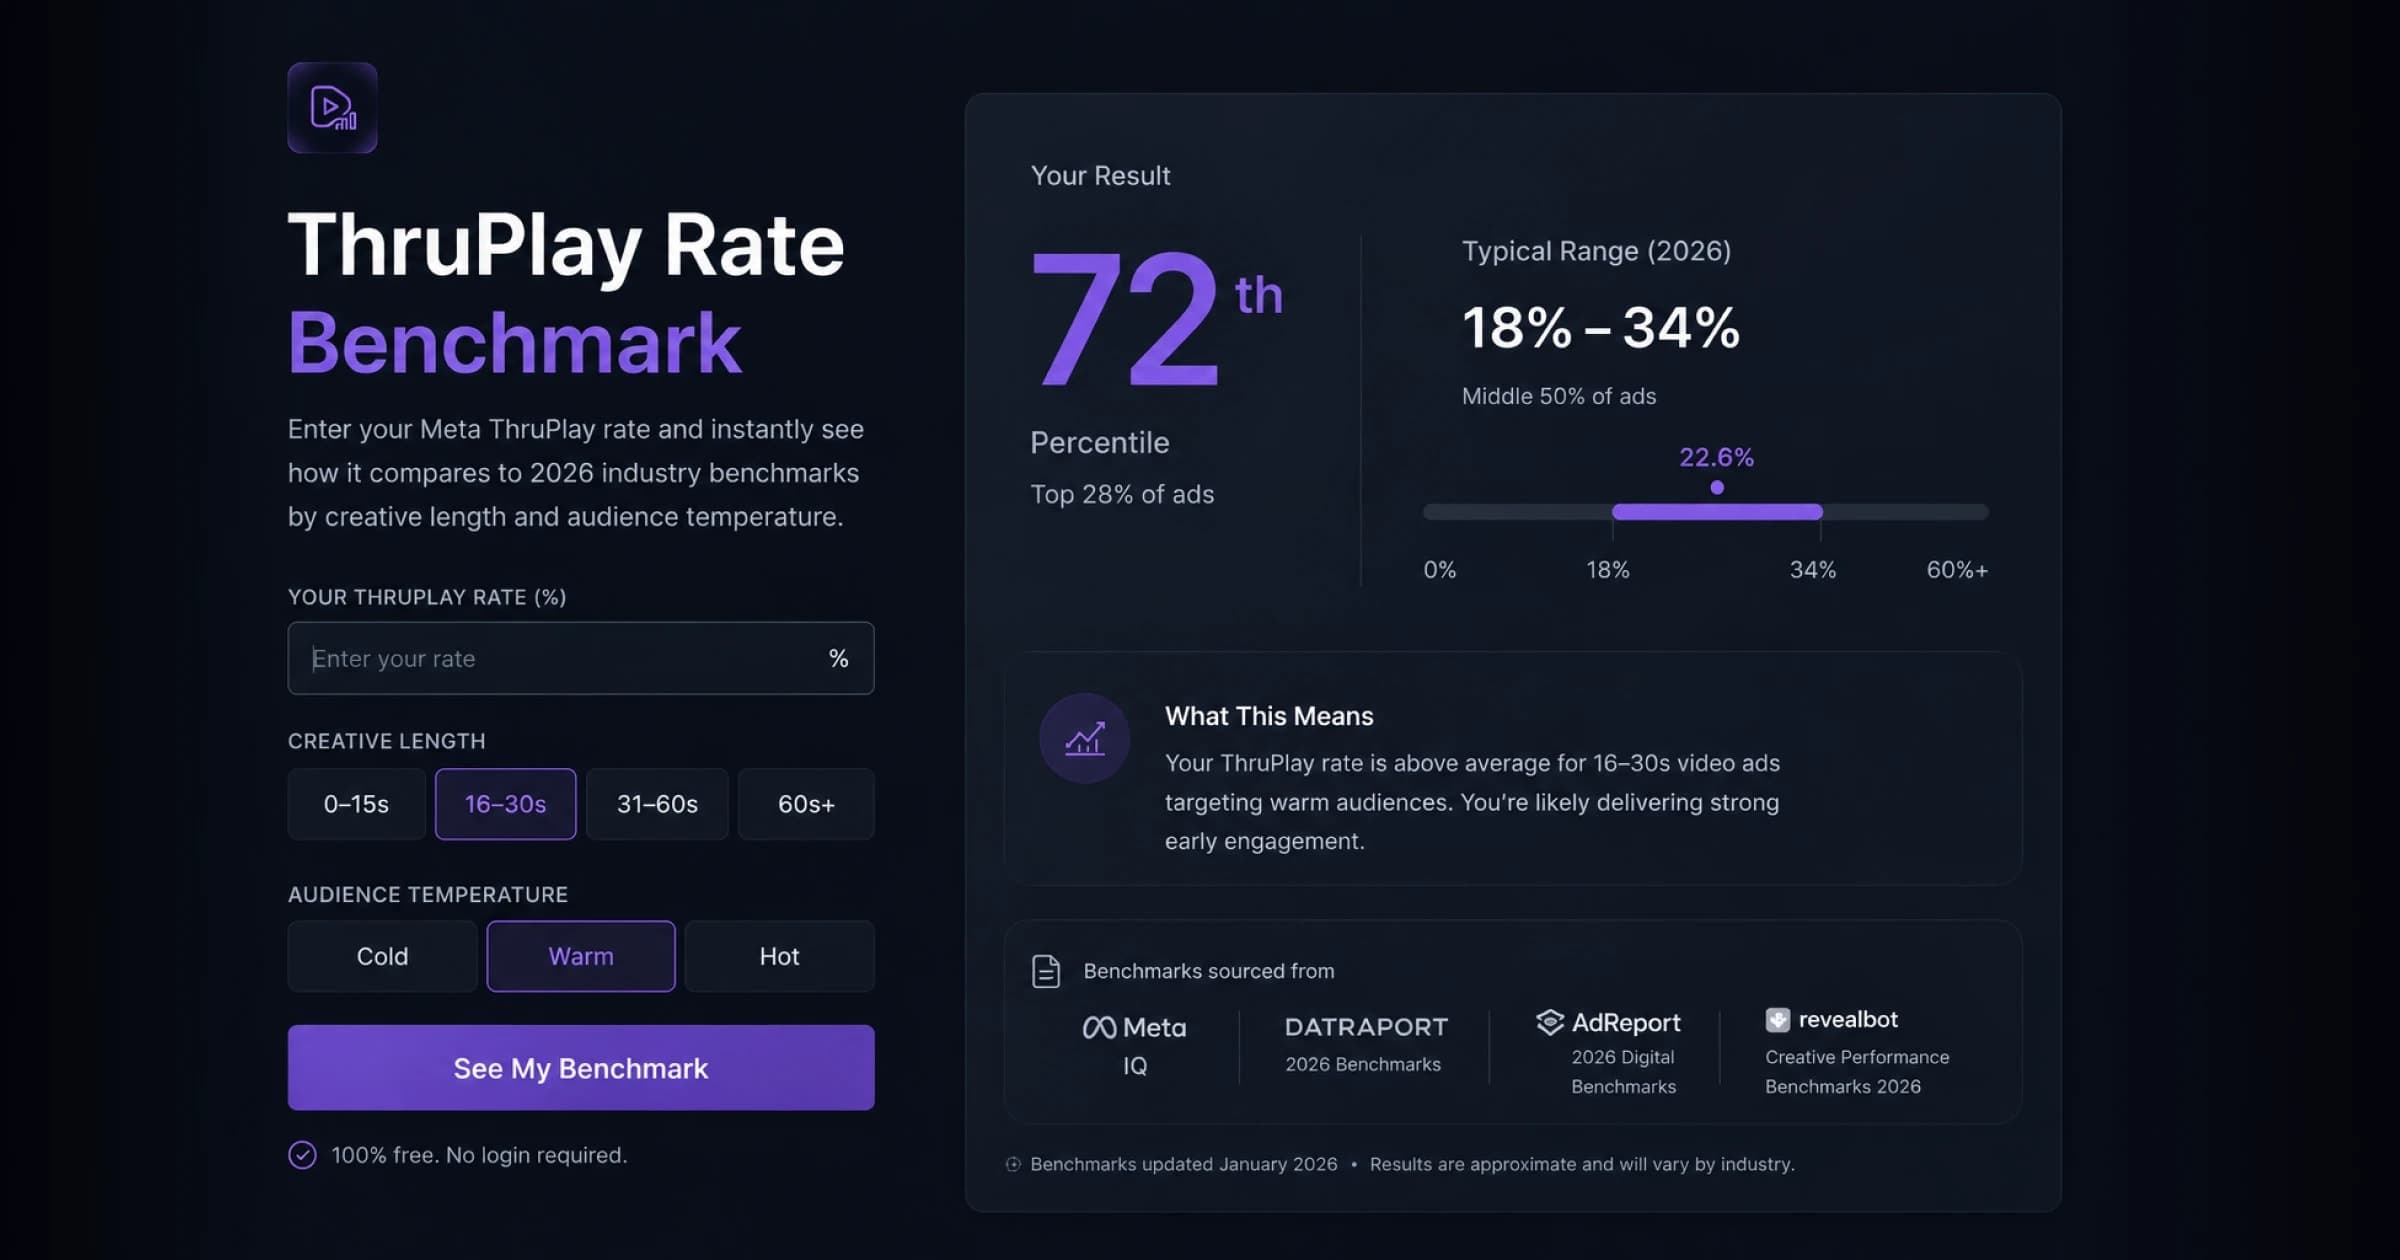
ThruPlay Rate Benchmark
Enter your Meta ThruPlay rate and instantly see how it compares to 2026 industry benchmarks by creative length and audience temperature. Free, no login — see where you land vs the cited typical range, with sources, and what your number means for creative performance.
Related Terms
Video Completion Rate
Video Completion Rate measures the percentage of video ad impressions that are watched to 100% completion. This metric helps evaluate creative engagement, message delivery effectiveness, and audience targeting accuracy while accounting for video length and placement quality. VCR is particularly important for brand messaging where full creative viewing is crucial.
Churn Rate
Churn rate measures the proportion of customers who discontinue their relationship with a company during a specific timeframe. For subscription businesses, this means cancellations or non-renewals. For non-subscription businesses, churn is often defined as no purchase activity within a set period. It's a critical metric for evaluating customer retention and business health.
Moving Average
A moving average is a statistical calculation that creates a series of averages from different subsets of data over time. By recalculating the average over a sliding window — commonly 7 or 28 days for ad data — it separates trend from noise, smoothing out short-term fluctuations and random outliers in metrics like CPC, CTR, or ROAS. Daily platform numbers are often too volatile to act on directly; the moving average is the version you can actually make decisions on.
