Paid Social Benchmarks
Enter your CPM, CPC, or CTR and see how it compares to current published benchmarks for Meta, TikTok, LinkedIn, and YouTube — segmented by campaign objective where the source splits them. Free, no login, every figure cited with source and year.
Free Analyzer
No sign up required. Use this analyzer as much as you need.

Paid Social Benchmarks
Loading analyzer...
The cited benchmark tables
Every figure the tool compares against, with its source and year. Ranges span the cited report’s lowest to highest industry figure unless a band is marked directional; medians are the report’s cross-industry figure. YouTube CPC is omitted deliberately — no current source publishes a typical band for it.
CPM benchmarks by platform(lower is better)
| Platform | Typical range | Median | Source |
|---|---|---|---|
| Meta (Facebook) | $7.19–$14.68 | $11.54 | Digital Applied 2026 Facebook Ads Benchmarks |
| TikTok | $5.40–$14.10 | $9.16 | Digital Applied 2026 TikTok Ads Benchmarks |
| $31–$38Directional | $34.50 | Closely 2026 LinkedIn Ad Benchmarks | |
| YouTube | $5–$10Directional | $7.50 | Store Growers 2026 YouTube Ads Benchmarks |
Methodology, sources & caveats per band
- Meta (Facebook): Objective drives the band: reach campaigns median $7.19, conversion campaigns $14.68, cross-industry average $11.54. Lebesgue’s 2026 per-industry spread ($6.96–$12.46) sits inside the same range. (Digital Applied 2026 Facebook Ads Benchmarks (Q1 2026 medians))
- TikTok: Dataset mix moves TikTok CPM a lot: Lebesgue’s 2026 conversion-optimized e-commerce average is $4.80 (typical $3–$15) while Triple Whale’s 2025 e-commerce dataset averages $13.26 — both fall inside this band. (Digital Applied 2026 TikTok Ads Benchmarks (in-feed industry span))
- LinkedIn: Directional — the source publishes a median band ($31–$38), not a low–high spread; the stored median is the band midpoint. High-competition sectors (SaaS, healthcare) run $50–$100. (Closely 2026 LinkedIn Ad Benchmarks (aggregated 2025 reports))
- YouTube: Directional — cited as “$5–$10 for most advertisers” with no central anchor; the stored median is the band midpoint. Connected-TV inventory prices materially higher. (Store Growers 2026 YouTube Ads Benchmarks (updated Feb 2026))
CPC benchmarks by platform(lower is better)
| Platform | Typical range | Median | Source |
|---|---|---|---|
| Meta (Facebook) · Traffic | $0.34–$1.22 | $0.70 | WordStream/LocaliQ 2025 Facebook Ads Benchmarks |
| Meta (Facebook) · Leads | $0.74–$9.78 | $1.92 | WordStream/LocaliQ 2025 Facebook Ads Benchmarks |
| TikTok | $0.74–$1.92 | $1.02 | Digital Applied 2026 TikTok Ads Benchmarks |
| $2.50–$8.04 | $3.94 | Closely 2026 LinkedIn Ad Benchmarks |
Methodology, sources & caveats per band
- Meta (Facebook) · Traffic: Band spans the lowest ($0.34, Shopping/Collectibles & Gifts) to highest ($1.22, Finance & Insurance) industry medians; $0.70 is the cross-industry median. (WordStream/LocaliQ 2025 Facebook Ads Benchmarks (Apr 2024–Jun 2025 medians))
- Meta (Facebook) · Leads: Band spans the lowest ($0.74, Restaurants & Food) to highest ($9.78, Dentists & Dental Services) industry medians — high-LTV service verticals stretch the top far above the $1.92 cross-industry median. (WordStream/LocaliQ 2025 Facebook Ads Benchmarks (Apr 2024–Jun 2025 medians))
- TikTok: Band spans the lowest ($0.74, Beauty & Personal Care) to highest ($1.92, Legal Services) industry figures. Lebesgue’s broader 2026 typical range is $0.20–$2.00 depending on bidding and audience. (Digital Applied 2026 TikTok Ads Benchmarks (in-feed industry span))
- LinkedIn: Median CPC $3.94; band spans the cheapest cited industry (Finance & Insurance, from $2.50) to the most expensive (SaaS/Software, up to $8.04). US-only campaigns typically price above the global figures. (Closely 2026 LinkedIn Ad Benchmarks (aggregated 2025 reports))
CTR benchmarks by platform(higher is better)
| Platform | Typical range | Median | Source |
|---|---|---|---|
| Meta (Facebook) · Traffic | 0.83%–4.13% | 1.71% | WordStream/LocaliQ 2025 Facebook Ads Benchmarks |
| Meta (Facebook) · Leads | 1.05%–3.92% | 2.59% | WordStream/LocaliQ 2025 Facebook Ads Benchmarks |
| TikTok | 0.5%–1.5% | 1% | Lebesgue 2026 TikTok Ads Benchmarks; Digital Applied 2026 TikTok Ads Benchmarks |
| 0.42%–0.8% | 0.52% | Closely 2026 LinkedIn Ad Benchmarks | |
| YouTube | 0.5%–2% | 0.65% | Store Growers 2026 YouTube Ads Benchmarks |
Methodology, sources & caveats per band
- Meta (Facebook) · Traffic: Band spans the lowest (0.83%, Physicians & Surgeons) to highest (4.13%, Shopping/Collectibles & Gifts) industry medians; 1.71% is the cross-industry median, up from 1.57% the prior year. (WordStream/LocaliQ 2025 Facebook Ads Benchmarks (Apr 2024–Jun 2025 medians))
- Meta (Facebook) · Leads: Band spans the lowest (1.05%, Dentists & Dental Services) to highest (3.92%, Arts & Entertainment) industry medians; 2.59% is the cross-industry median. (WordStream/LocaliQ 2025 Facebook Ads Benchmarks (Apr 2024–Jun 2025 medians))
- TikTok: Lebesgue’s conversion-optimized e-commerce dataset averages 0.61% while Triple Whale’s 2025 cross-brand dataset averages 1.77% — objective and vertical mix move TikTok CTR more than most platforms, so read the verdict directionally. (Lebesgue 2026 TikTok Ads Benchmarks (typical range); Digital Applied 2026 TikTok Ads Benchmarks (cross-industry average))
- LinkedIn: Median 0.52%; band spans the lowest cited industry (Education, 0.42%) to the highest (Retail, 0.80%). Single-image Sponsored Content typically lands at 0.50%–0.60%. (Closely 2026 LinkedIn Ad Benchmarks (aggregated 2025 reports))
- YouTube: Overall average 0.65% with skippable in-stream typically 0.5%–2.0% — YouTube CTR behaves like display, not search; view rate is the primary engagement metric for in-stream. (Store Growers 2026 YouTube Ads Benchmarks (updated Feb 2026))
Definitions, formulas, and per-industry tables live in the glossary: What is a good CPM? · What is a good CPC? · What is a good CTR?
Platform averages only help if you compare like with like: a $14 CPM is routine for Meta conversion campaigns and triple the norm for TikTok in-feed, and a 1% CTR is strong on LinkedIn but below par for Meta traffic campaigns. This tool keeps the comparison honest — pick the metric, platform, and (on Meta) objective, and it verdicts your number against the cited typical range, with the full source tables rendered below. Ranges come from currently published benchmark reports (WordStream/LocaliQ, Digital Applied, Lebesgue, Closely, Store Growers) and keep each source’s precision exactly. For definitions, formulas, and per-industry tables, see the CPM, CPC, and CTR glossary entries; when a cost metric drifts out of range, the usual root cause is creative — benchmark your hook rate next.
Frequently Asked Questions
Related Calculators

CPA Calculator
Free CPA calculator: realized cost per acquisition from spend and conversions, funnel CPA from CPC or CPM × CTR × CVR, break-even CPA from margin, target CAC from LTV, and target CPA from ROAS — with cited 2026 lead-CPL and ecommerce-purchase bands. CSV export. No sign-up.

CPM Calculator
Calculate Cost Per Mille (CPM) and analyze advertising campaign performance with precision. Get comprehensive insights on media buying efficiency, budget optimization, and campaign ROI analysis.
ROAS Calculator
Calculate and analyze your return on ad spend (ROAS) to optimize campaign performance. Get data-driven insights on advertising efficiency, revenue attribution, and budget allocation to maximize marketing ROI.
Related Analyzers
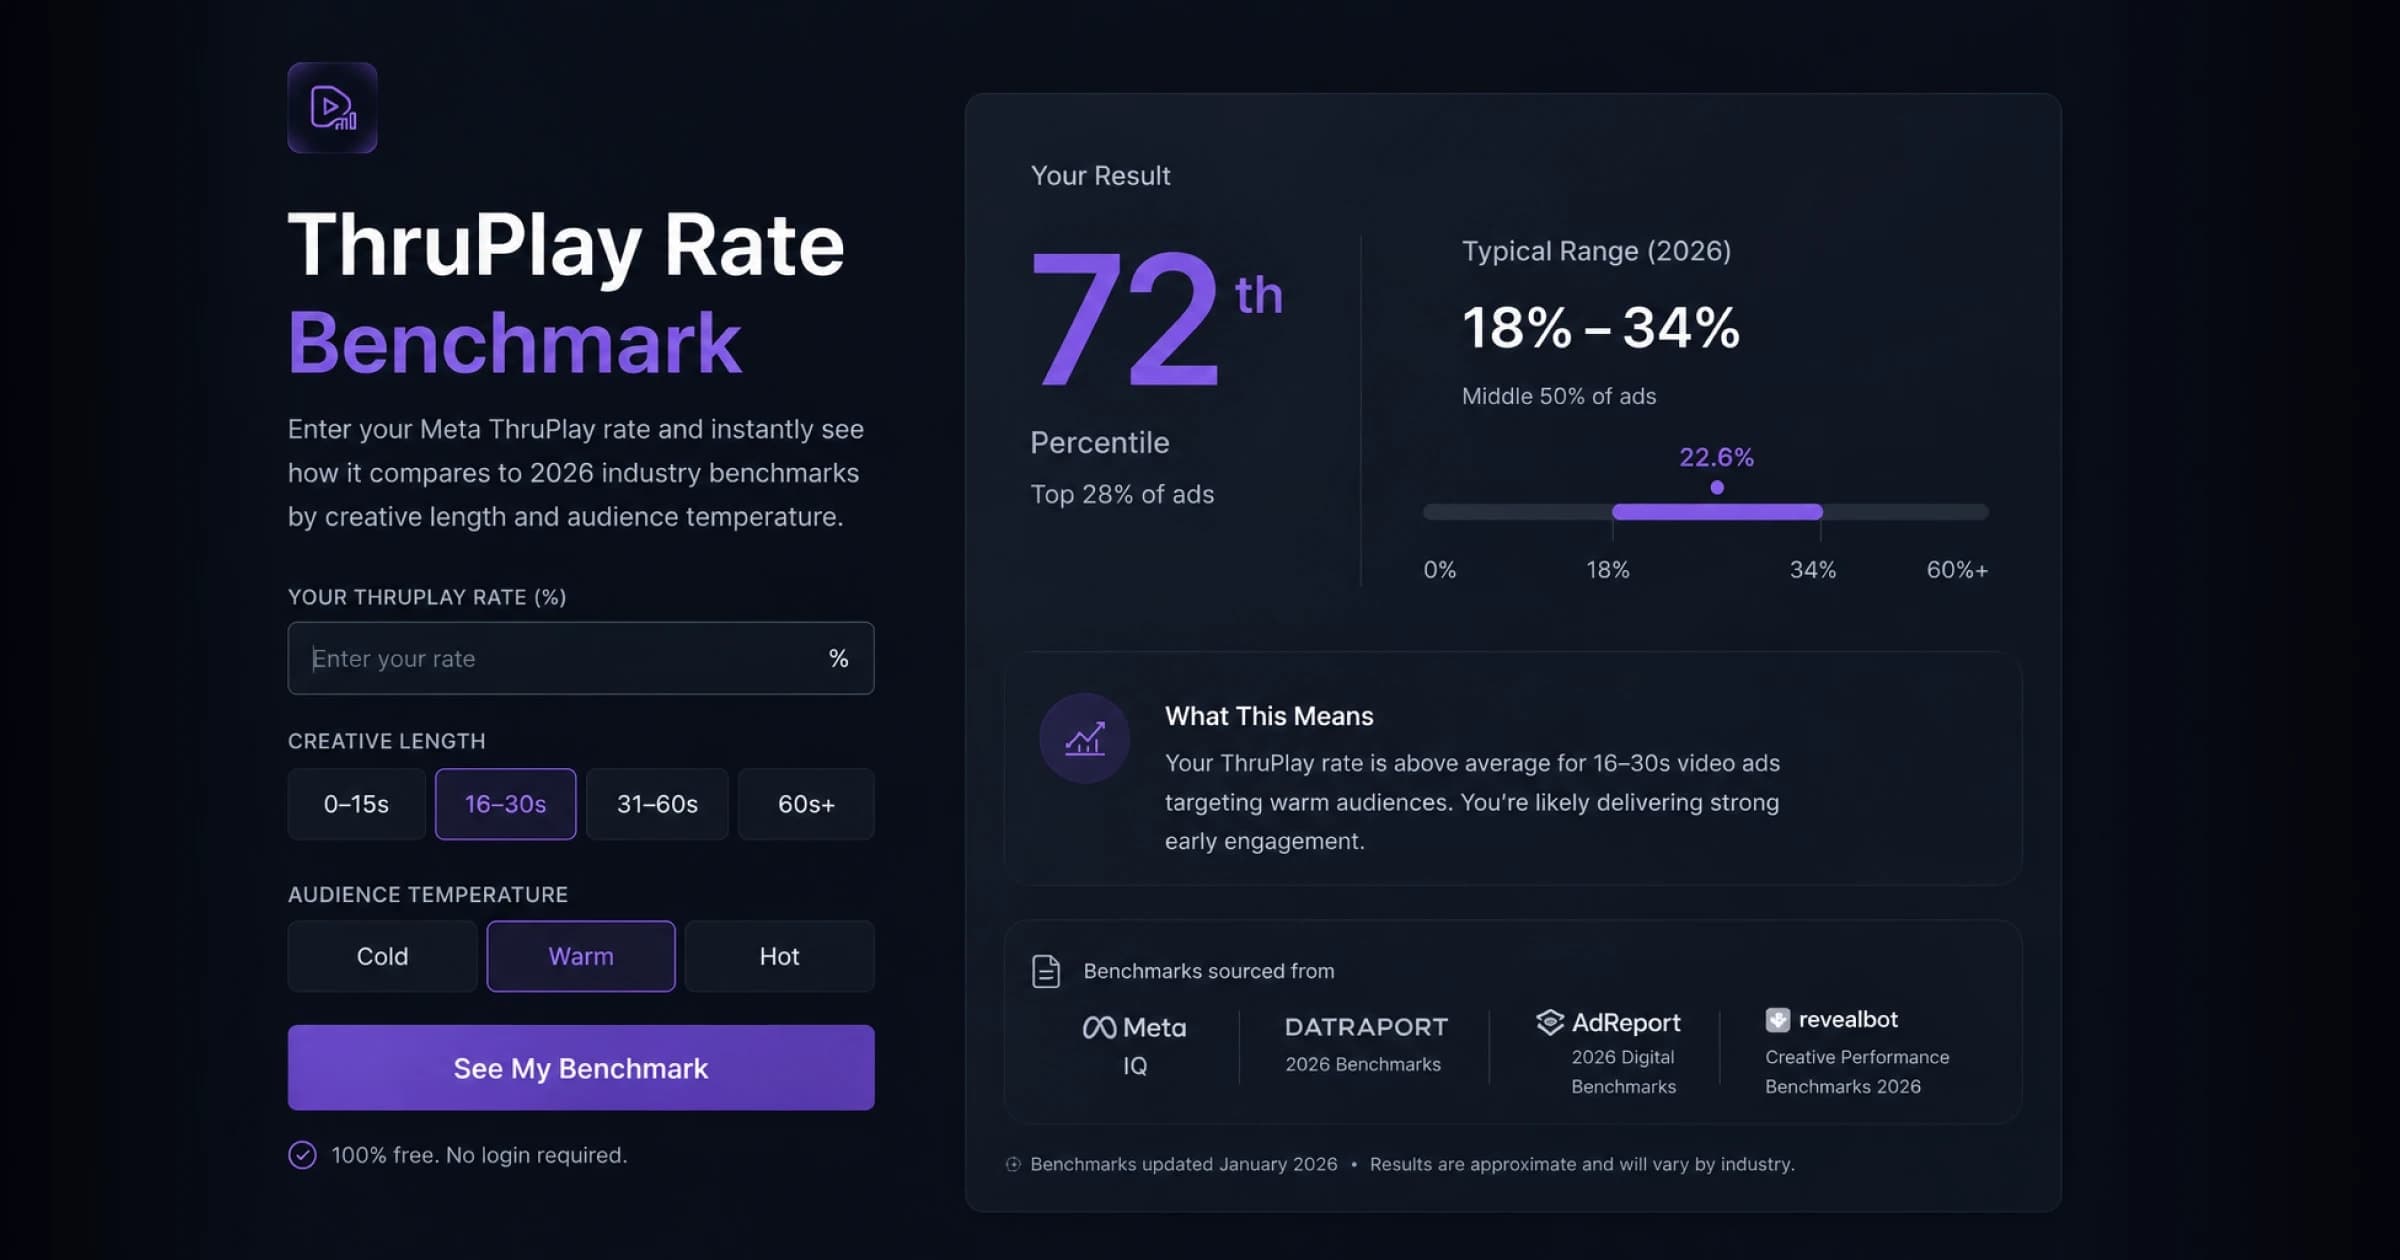
ThruPlay Rate Benchmark
Enter your Meta ThruPlay rate and instantly see how it compares to 2026 industry benchmarks by creative length and audience temperature. Free, no login — see where you land vs the cited typical range, with sources, and what your number means for creative performance.
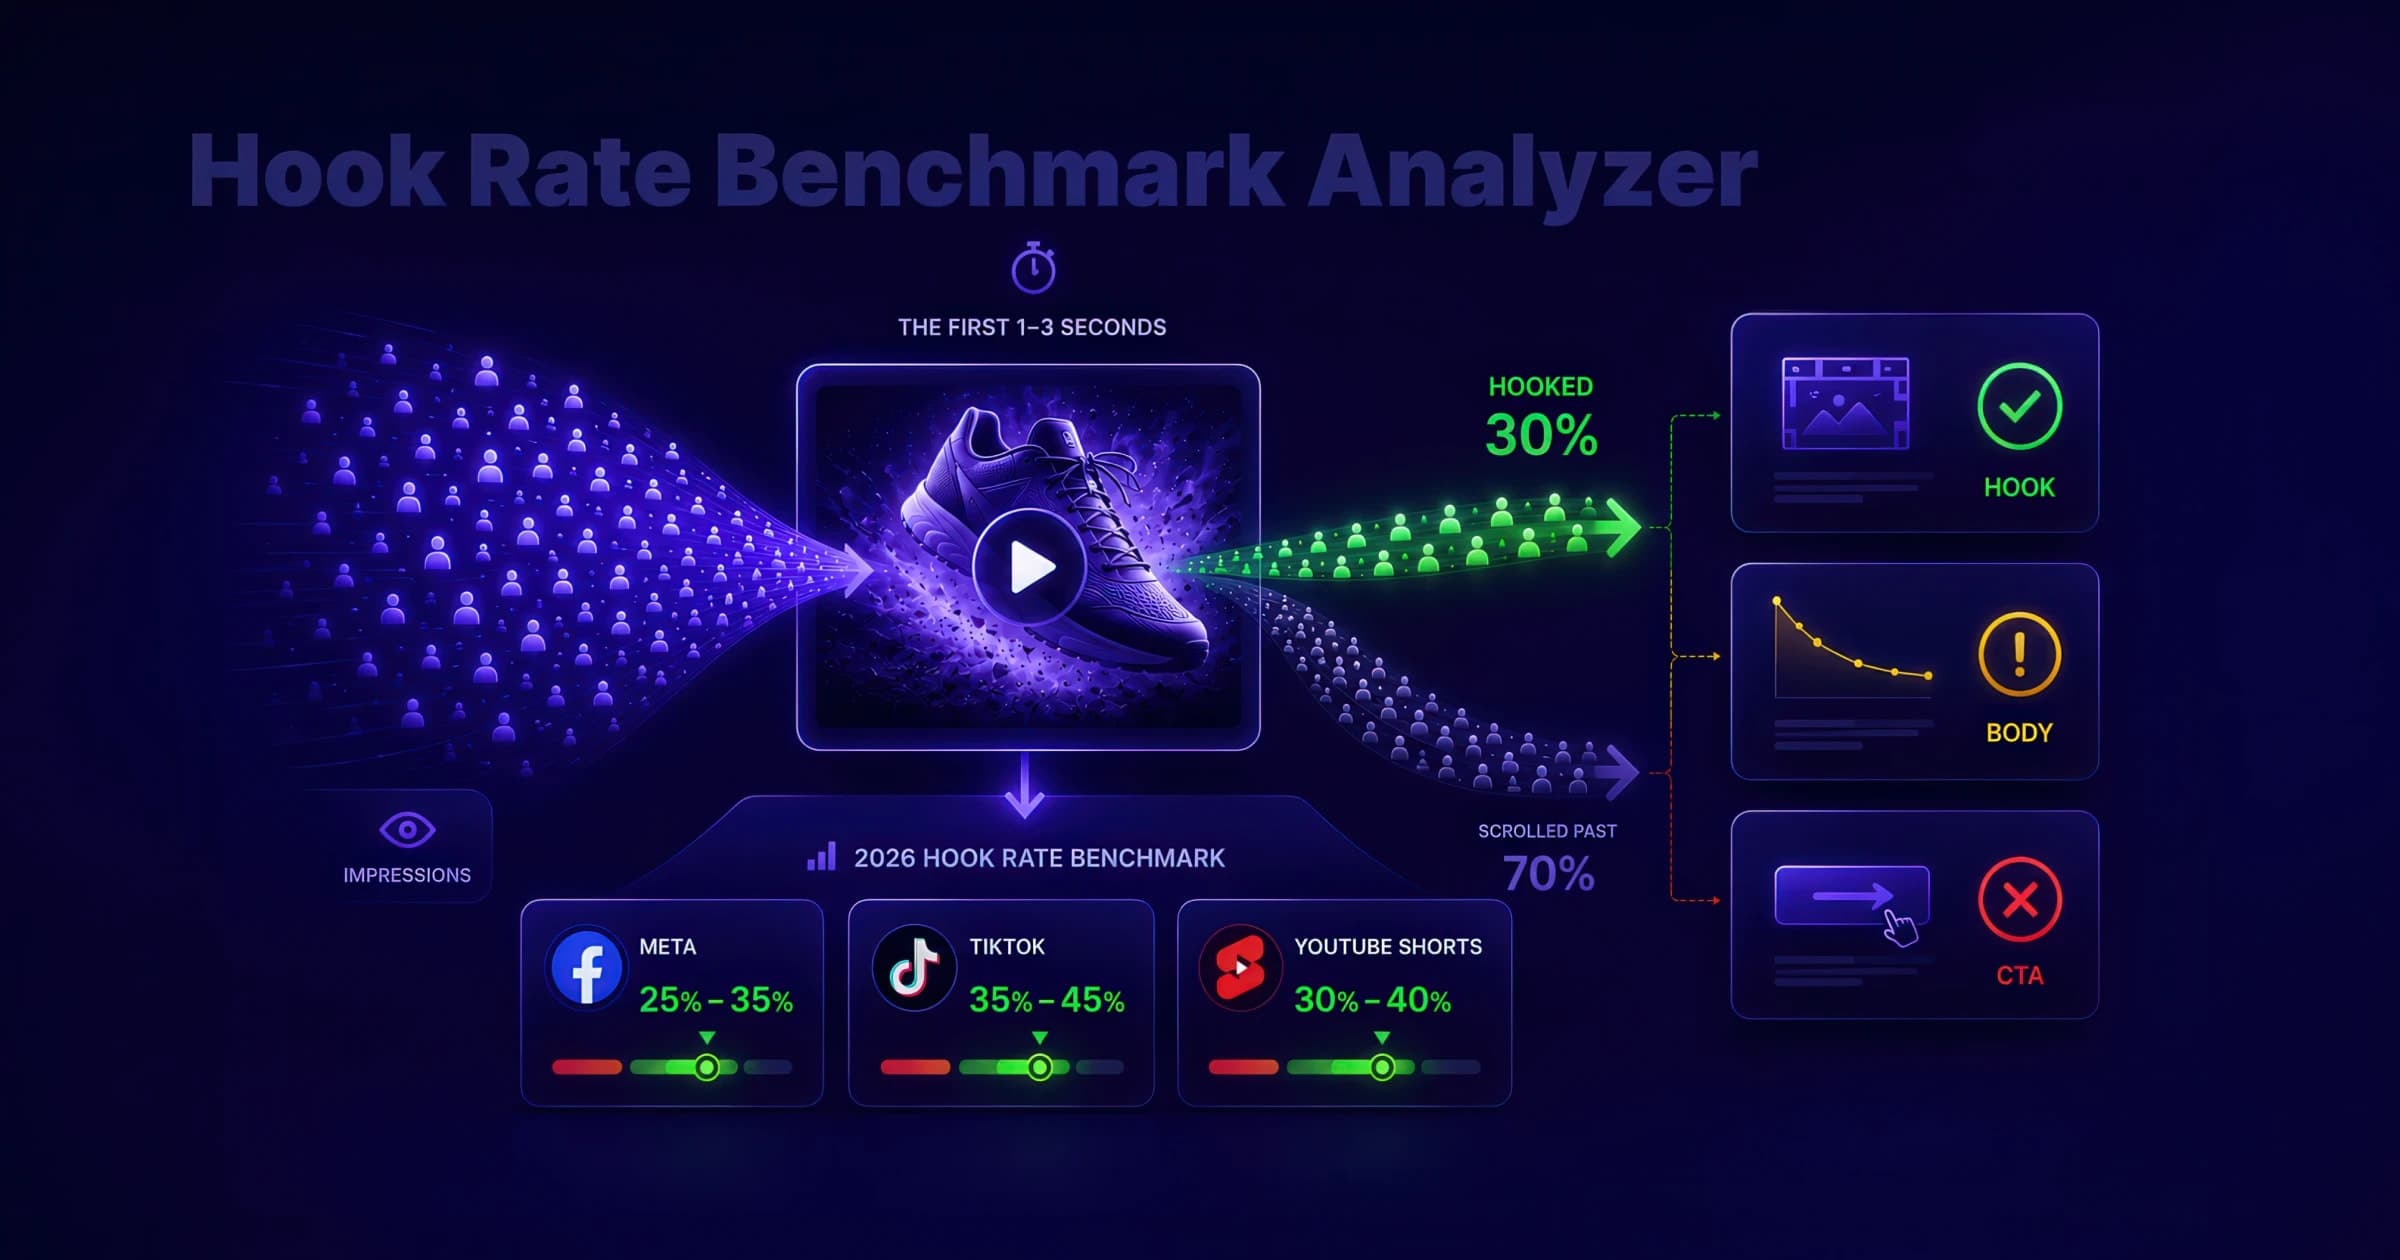
Hook Rate Benchmark
Calculate hook rate (thumbstop rate) for Meta, TikTok, and YouTube Shorts, compare it to 2026 benchmark ranges, and diagnose whether your video ad needs a stronger first frame, tighter body, or clearer CTA.

Creative Quality Grader
Grade your ad creatives and get actionable recommendations for improvement. This creative quality grader tool evaluates key elements like visual design, messaging, CTAs, accessibility, and platform optimization to help you create high-performing ads across Facebook, Instagram, TikTok, and YouTube. Get detailed scores and personalized tips to optimize your creative strategy.
Related Terms
Click-Through Rate
Click-Through Rate (CTR) measures the ratio of clicks to impressions for a digital advertisement, email, or other clickable content. It's a fundamental metric for evaluating creative relevance, audience targeting quality, and overall ad effectiveness in driving user engagement. CTR varies significantly by format, placement, and channel, making context crucial for performance evaluation.
Cost Per Mille
Cost Per Mille (CPM) represents the cost an advertiser pays to deliver 1,000 ad impressions to their target audience. This metric is fundamental for media planning and buying, enabling comparison of advertising costs across different platforms, formats, and audience segments. CPM pricing reflects placement quality, audience targeting precision, and market demand.
Cost Per Click
Cost Per Click (CPC) represents the average cost an advertiser pays for each click on their advertisement. In auction-based platforms, actual CPC is determined through a combination of bid amount, quality score, and competition. This metric is fundamental for measuring traffic acquisition efficiency and comparing costs across channels and campaigns.
