Guide
Benchmarks & how to read your result
How to read and act on your result — research-backed context with linked sources for every benchmark cited.
How ROAS is Calculated
ROAS is calculated by dividing your total revenue from advertising by your total advertising spend. The formula is: ROAS = Revenue / Ad Spend
For example, if you spent $1,000 on ads and generated $4,000 in revenue, your ROAS would be 4:1 (or 4.0).
Good ROAS Benchmarks by Industry
There is no single "good" ROAS — the right target depends on your gross margin, attribution model, and growth stage. The ranges below are typical reported benchmarks; always compare them against your own break-even ROAS (the multiple you need to cover product cost, fulfillment, and operating expenses), not an industry average in isolation.
Direct-to-Consumer e-commerce
- Typical ROAS range
- 2.5x – 4.0x
- Median
- 3.0x
B2B SaaS (multi-touch view)
- Typical ROAS range
- 3.0x – 5.0x
- Median
- 3.8x
Lead Generation
- Typical ROAS range
- 1.5x – 3.0x
- Median
- 2.0x
Mobile Apps (in-app revenue)
- Typical ROAS range
- 1.2x – 2.5x
- Median
- 1.6x
- Source
- AppsFlyer / Adjust 2024
Retail (omni-channel)
- Typical ROAS range
- 4.0x – 8.0x
- Median
- 5.5x
| Segment | Typical ROAS range | Median | Source |
|---|---|---|---|
| Direct-to-Consumer e-commerce | 2.5x – 4.0x | 3.0x | WordStream / LocaliQ 2024Common Thread Collective DTC Index |
| B2B SaaS (multi-touch view) | 3.0x – 5.0x | 3.8x | FirstPageSage 2025 Marketing ROI |
| Lead Generation | 1.5x – 3.0x | 2.0x | WordStream / LocaliQ 2024 |
| Mobile Apps (in-app revenue) | 1.2x – 2.5x | 1.6x | AppsFlyer / Adjust 2024 |
| Retail (omni-channel) | 4.0x – 8.0x | 5.5x | Nielsen Compass Norms 2025FirstPageSage 2025 |
Worked example: ROAS from revenue and spend
A DTC brand spends $25,000 on Meta ads and generates $100,000 in attributed revenue at 40% gross margin.
- ROAS = $100,000 ÷ $25,000 = 4.0×
- Break-even ROAS = 1 ÷ 0.40 = 2.5× (profitable)
- POAS = ($100,000 × 40%) ÷ $25,000 = 1.6× profit on ad spend
At 25% margin the same 4.0× ROAS breaks even (break-even = 4.0×). Margin context changes the verdict — a 3× ROAS at 25% gross margin is unprofitable even when the platform celebrates the number.
ROAS performance guide
Below Break-Even
- Status
- Losing money
- What It Means
- Revenue does not cover COGS + ad spend
Break-Even to Break-Even + 50%
- Status
- Profitable, thin
- What It Means
- Room to scale only if MER confirms
Above Break-Even + 50%
- Status
- Healthy
- What It Means
- Typical scale zone for prospecting
Above 2× Break-Even
- Status
- Excellent
- What It Means
- Verify incrementality before 3× budget
| ROAS vs. Break-Even | Status | What It Means |
|---|---|---|
| Below Break-Even | Losing money | Revenue does not cover COGS + ad spend |
| Break-Even to Break-Even + 50% | Profitable, thin | Room to scale only if MER confirms |
| Above Break-Even + 50% | Healthy | Typical scale zone for prospecting |
| Above 2× Break-Even | Excellent | Verify incrementality before 3× budget |
ROAS benchmarks by ad platform (2025–2026)
Google Search
- Typical ROAS range
- 2.0× – 5.0×
- Notes
- Highest intent
Google Shopping
- Typical ROAS range
- 3.0× – 8.0×
- Notes
- eCommerce product listings
Meta (prospecting)
- Typical ROAS range
- 2.0× – 4.0×
- Notes
- EcomHint avg 2.2×
Meta (retargeting)
- Typical ROAS range
- 3.5× – 6.0×
- Notes
- EcomHint retargeting 3.61×
TikTok
- Typical ROAS range
- 1.4× – 3.0×
- Notes
- EcomHint avg 1.4×
LinkedIn (B2B)
- Typical ROAS range
- 2.0× – 4.0×
- Notes
- High CPC, high deal value
| Platform | Typical ROAS range | Notes |
|---|---|---|
| Google Search | 2.0× – 5.0× | Highest intent |
| Google Shopping | 3.0× – 8.0× | eCommerce product listings |
| Meta (prospecting) | 2.0× – 4.0× | EcomHint avg 2.2× |
| Meta (retargeting) | 3.5× – 6.0× | EcomHint retargeting 3.61× |
| TikTok | 1.4× – 3.0× | EcomHint avg 1.4× |
| LinkedIn (B2B) | 2.0× – 4.0× | High CPC, high deal value |
Common mistakes
- Ignoring margin. A 3× ROAS at 25% gross margin is unprofitable.
- Trusting platform-reported ROAS. Incremental ROAS is often 30–60% lower than attributed.
- Mixing prospecting and retargeting. Retargeting inflates blended ROAS.
- Using industry average as target. Break-even ROAS from your margin is the floor.
- Scaling on attributed ROAS while MER flatlines. Attribution overlap double-counts.
How to improve ROAS
- Optimize landing pages (conversion rate is a free ROAS lever)
- Negative keywords / audience exclusions
- High-intent query focus ("buy", "pricing", "demo")
- Retargeting for warm traffic
- Increase AOV (bundles, upsells)
- Separate prospecting vs retargeting reporting
- Run incrementality holdout to find true ROAS ceiling
ROAS vs. MER vs. ROI
These three numbers answer different questions, and the most common reporting mistake is using one where another belongs:
- ROAS = Attributed Revenue ÷ Ad Spend. Narrowest and best for in-channel optimization (which campaigns to scale, which creatives to cut). It is inflated by attribution overlap — every platform claims the same conversion — so the sum of channel ROAS overstates true performance.
- MER (Marketing Efficiency Ratio) = Total Revenue ÷ Total Marketing Spend. Broadest and best for budget and whole-program decisions; it ignores attribution entirely and includes organic and email revenue. A frequent failure mode is scaling on platform ROAS while blended MER quietly goes sideways on duplicated attribution.
- ROI = (Net Profit ÷ Total Investment) × 100%. The truest profitability measure, because it nets out all costs — product, fulfillment, headcount — not just ad spend.
Use ROAS for tactical channel decisions, MER for strategic budget decisions, and ROI for the bottom-line view. See the Marketing Efficiency Ratio Calculator and the ROAS, MER, aMER, and nMER entries in the Marketing Glossary to compare them in depth.
Methodology & sources
Benchmark ranges synthesize published industry reports (2024–2026). Medians are midpoints of stated ranges unless a report publishes an explicit median. Always validate against your break-even ROAS (1 ÷ gross margin) before scaling.
WordStream & LocaliQ Online Advertising Benchmarks
Cross-industry ROAS and CPC baselines
FirstPageSage Marketing ROI Report
B2B SaaS and retail ROAS ranges
Common Thread Collective DTC Index
DTC e-commerce efficiency benchmarks
Platform-level ROAS composites
Omni-channel retail media norms
Return on Ad Spend (ROAS) Calculator
Calculate and analyze your return on ad spend (ROAS) to optimize campaign performance. Get data-driven insights on advertising efficiency, revenue attribution, and budget allocation to maximize marketing ROI.
Free Calculator
No sign up required. Use this calculator as much as you need.
Stop calculating by hand
Want AI to track this across every creative variant — and tie it back to ROAS automatically? That’s what AdSights does.
Request early accessRelated Calculators

CPA Calculator
Free CPA calculator: realized cost per acquisition from spend and conversions, funnel CPA from CPC or CPM × CTR × CVR, break-even CPA from margin, target CAC from LTV, and target CPA from ROAS — with cited 2026 lead-CPL and ecommerce-purchase bands. CSV export. No sign-up.

CPM Calculator
Calculate Cost Per Mille (CPM) and analyze advertising campaign performance with precision. Get comprehensive insights on media buying efficiency, budget optimization, and campaign ROI analysis.

Incrementality Calculator
Measure the true impact of your marketing campaigns by calculating incrementality. Understand which portion of your conversions would have happened organically versus those directly caused by your marketing efforts.
Related Analyzers
Paid Social Benchmarks
Enter your CPM, CPC, or CTR and see how it compares to current published benchmarks for Meta, TikTok, LinkedIn, and YouTube — segmented by campaign objective where the source splits them. Free, no login, every figure cited with source and year.
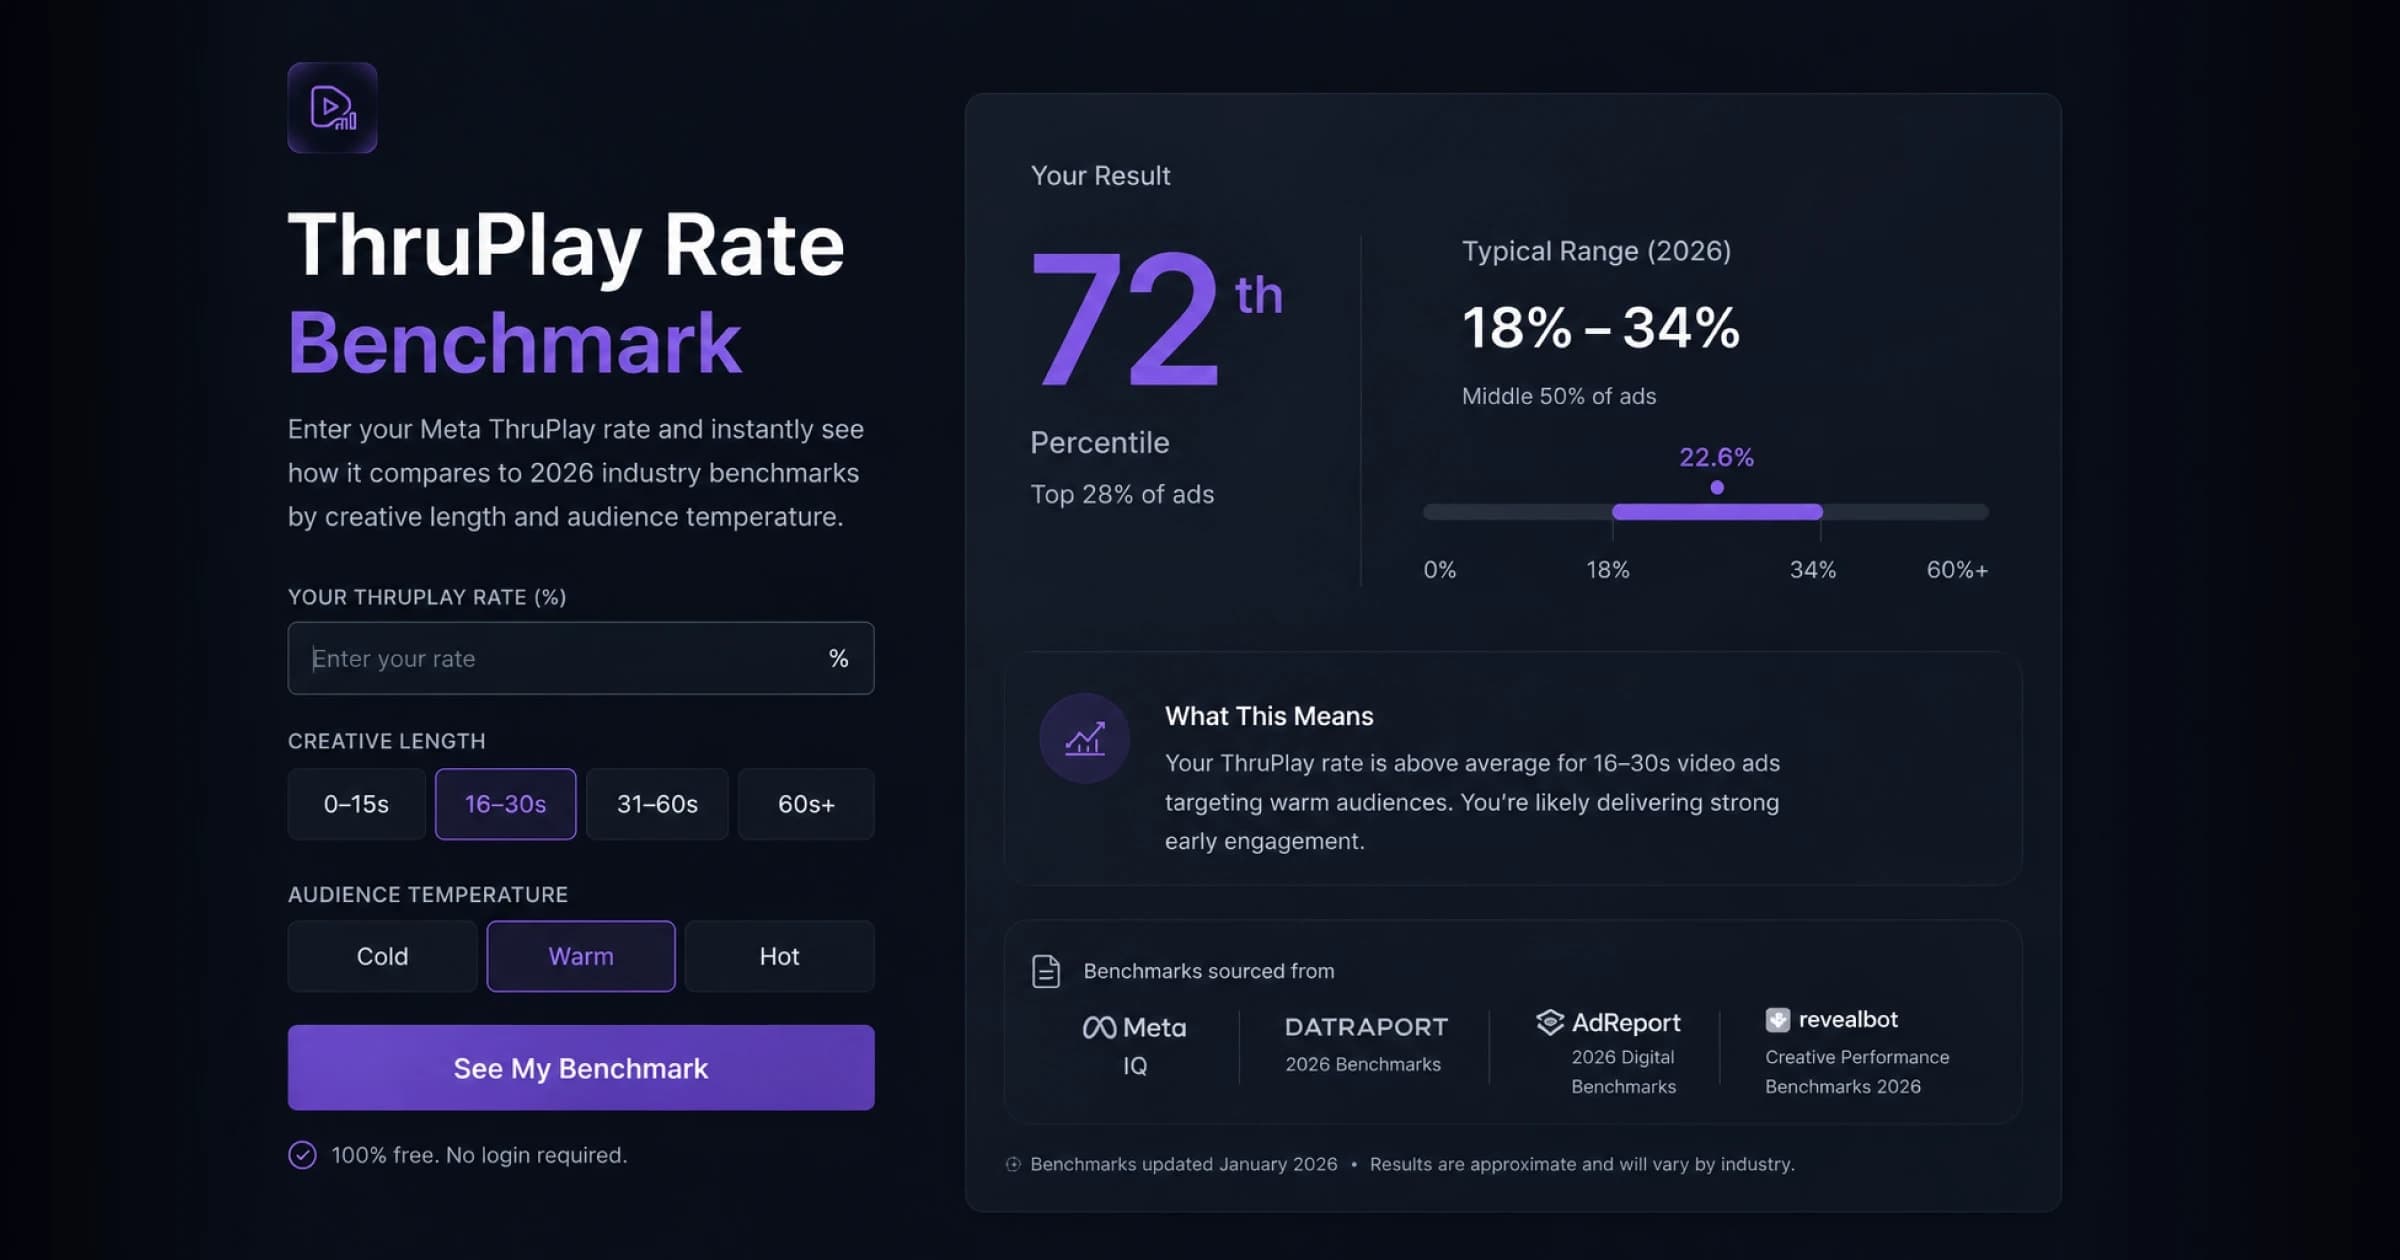
ThruPlay Rate Benchmark
Enter your Meta ThruPlay rate and instantly see how it compares to 2026 industry benchmarks by creative length and audience temperature. Free, no login — see where you land vs the cited typical range, with sources, and what your number means for creative performance.

Hook Rate Benchmark
Calculate hook rate (thumbstop rate) for Meta, TikTok, and YouTube Shorts, compare it to 2026 benchmark ranges, and diagnose whether your video ad needs a stronger first frame, tighter body, or clearer CTA.
Related Terms
Return on Ad Spend
Return on Ad Spend (ROAS) is a marketing performance metric that measures the revenue generated per dollar of advertising spend. Unlike ROI which considers all business costs, ROAS specifically evaluates advertising efficiency by comparing directly attributable revenue to ad spend. This metric is crucial for optimizing campaign performance, budget allocation, and overall marketing strategy.
Marketing Efficiency Ratio
Marketing Efficiency Ratio measures the overall effectiveness of marketing spend by comparing total revenue to total marketing costs. It provides a holistic view of marketing performance across all channels and customer types, including both direct and indirect revenue attribution. Also known as 'blended MER' since it considers all revenue rather than just attributed revenue.
Return on Investment
Return on Investment measures the profitability of an investment by comparing the net profit (revenue minus all costs) to the total investment cost. In marketing, it considers all costs including media spend, creative production, technology, overhead, and operational expenses, making it a more comprehensive metric than ROAS which focuses specifically on ad spend.
