
Guide
Benchmarks & how to read your result
How to read and act on your result — research-backed context with linked sources for every benchmark cited.
How the Calculator Works
The Creative Testing Budget Calculator helps advertisers determine the optimal budget and sample size needed to test different ad creatives effectively. By inputting key variables such as the number of creative variations, expected action rates, CPM, statistical significance, and minimum detectable effect (MDE), the calculator estimates:
- Total required budget
- Per-variation budget
- Required impressions and conversion events
- Estimated timeframe for testing
Understanding Minimum Detectable Effect (MDE)
MDE is the smallest improvement in performance that your test needs to detect to be considered statistically significant:
- Lower MDE (e.g., 10%): Requires larger budget but catches small improvements
- Higher MDE (e.g., 50%): Requires less budget but may miss incremental gains
Optimization Tip: If your budget is limited, consider raising the MDE threshold to focus on detecting more substantial improvements.
Budget Variations by Action Type
Different actions have vastly different baseline rates, affecting required budgets:
Engagement Actions
- Typical Rate: 1% to 5%
- Examples: CTR, clicks, video views
- Budget Impact: Lower budget required due to higher frequency
Lead Actions
- Typical Rate: 0.1% to 1%
- Examples: Form fills, sign-ups
- Budget Impact: Moderate budget required
Purchase Actions
- Typical Rate: 0.01% to 0.5%
- Examples: Sales, transactions
- Budget Impact: Highest budget required due to lower frequency
Budget-Smart Strategy: Start with an engagement test to identify top performing creatives, then run a smaller purchase test with the best variations.
Statistical Significance Impact
Statistical significance determines test result reliability:
- 70% Confidence: Lower budget but more risk of false positives
- 80% Confidence: Balanced approach with good budget efficiency and reliability
- 90% Confidence: Higher budget but provides more reliable results
Optimization Tip: If you need to reduce costs, lowering the confidence level from 90% to 80% can significantly cut required impressions while maintaining strong test validity.
Test Duration Guidelines
A well-structured test should run for at least 2-3 weeks to:
- Account for day-of-week effects (weekends vs. weekdays perform differently)
- Allow platform ad-serving algorithms to stabilize
- Ensure sufficient data collection for meaningful results
Warning: Ending a test too early (before reaching required event counts) can lead to misleading conclusions and wasted ad spend.
Sample Size Requirements
The calculator determines required impressions and events based on your expected action rate and statistical significance requirements:
- Rule of Thumb: Aim for 200+ events per variation before drawing conclusions
- Balanced Distribution: Ensure equal impressions across variations to avoid biased results
Common Mistake to Avoid: If one variation gets significantly more impressions than others due to algorithmic bias, the results may not be valid.
Budget Optimization Strategies
Three Proven Ways to Reduce Costs While Maintaining Test Validity:
- Increase MDE: Detect larger performance differences instead of small incremental changes
- Lower Confidence Level: Dropping from 90% to 80% reduces required impressions while maintaining reliability
- Use Engagement Tests First: Identify top-performing creatives with cheaper metrics before running costly conversion tests
Budget-Smart Strategy: Start with a CTR or video view test to narrow down the best-performing ads before spending on conversion testing.
Interpreting Results
Once the test concludes:
- Compare Key Metrics: CTR, conversion rate, CPA, etc. across variations
- Ensure Statistical Reliability: Winning creative reached at least 200+ events
- Consider Statistical Significance: If differences are significant, roll out the top performer
- Handle Inconclusive Results: You may need a larger sample size or longer duration
Common Pitfall to Avoid: Declaring a winner too early based on limited data—wait until the test has enough conversions to be reliable.
Applying Insights to Future Campaigns
The best-performing creatives should:
- Be scaled up with increased budget allocation
- Serve as a blueprint for future iterations (colors, messaging, CTA placement)
- Be tested in new audience segments to further optimize performance
- Be leveraged as templates for future ad creative concepts
Pro Tip: Once you identify a strong creative, try iterative testing—small refinements (e.g., different CTA buttons) to further improve results.
Methodology & sources
Budget estimates use binomial power analysis for conversion-rate differences across variations. The 200-events-per-variation rule is a practical floor — low baseline rates (purchases) require far more impressions than engagement metrics at the same MDE.
Creative test setup and learning-phase guidance
Creative testing spend and iteration norms
Evan Miller Sample Size Calculator
Per-variation sample size reference
WordStream & LocaliQ Benchmarks
Baseline CTR and conversion rates for MDE planning
Creative Testing Budget Calculator
Plan your creative testing budget effectively with our comprehensive calculator. Get expert recommendations for test duration, sample size, and budget allocation to ensure statistically significant results.
Free Calculator
No sign up required. Use this calculator as much as you need.
Stop calculating by hand
Want AI to track this across every creative variant — and tie it back to ROAS automatically? That’s what AdSights does.
Request early accessRelated Calculators
UGC Cost Calculator
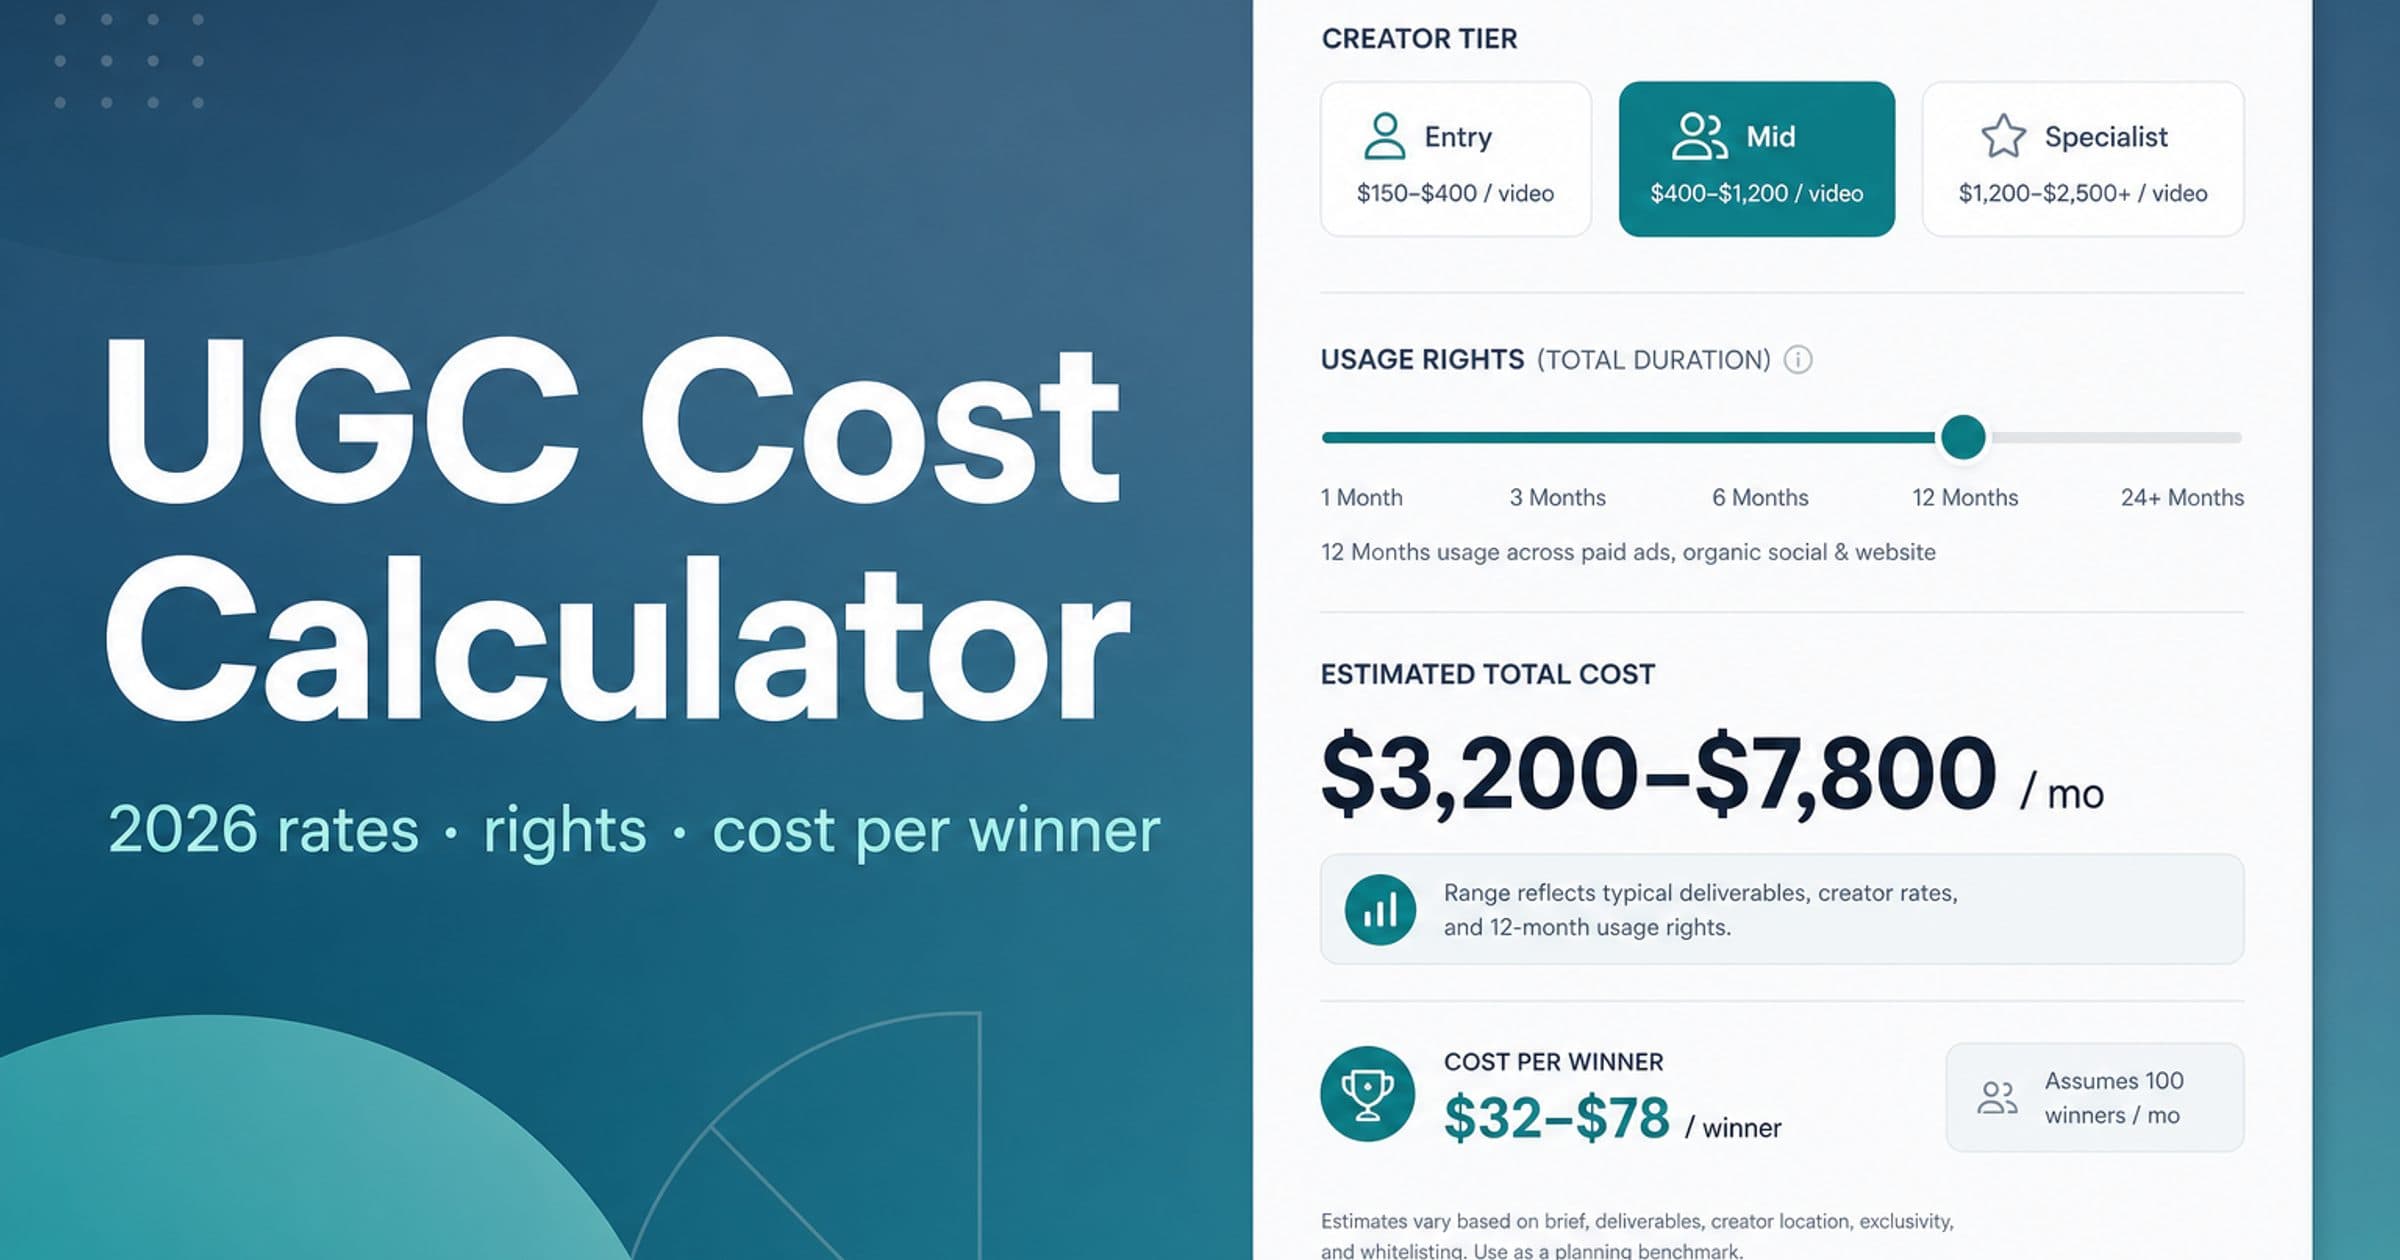
Free UGC cost calculator with independently researched 2026 creator rates, paid usage-rights uplifts, whitelisting, niche premiums, DIY vs agency vs hybrid AI paths, and cost-per-winner framing. Export your scenario to CSV.

A/B Test Significance Calculator
Make data-driven decisions with our A/B test significance calculator. Analyze test results with statistical rigor, determine confidence levels, and get actionable recommendations for test duration and sample size requirements.

Incrementality Calculator
Measure the true impact of your marketing campaigns by calculating incrementality. Understand which portion of your conversions would have happened organically versus those directly caused by your marketing efforts.
Related Analyzers

Creative Quality Grader
Grade your ad creatives and get actionable recommendations for improvement. This creative quality grader tool evaluates key elements like visual design, messaging, CTAs, accessibility, and platform optimization to help you create high-performing ads across Facebook, Instagram, TikTok, and YouTube. Get detailed scores and personalized tips to optimize your creative strategy.
Hook Rate Benchmark
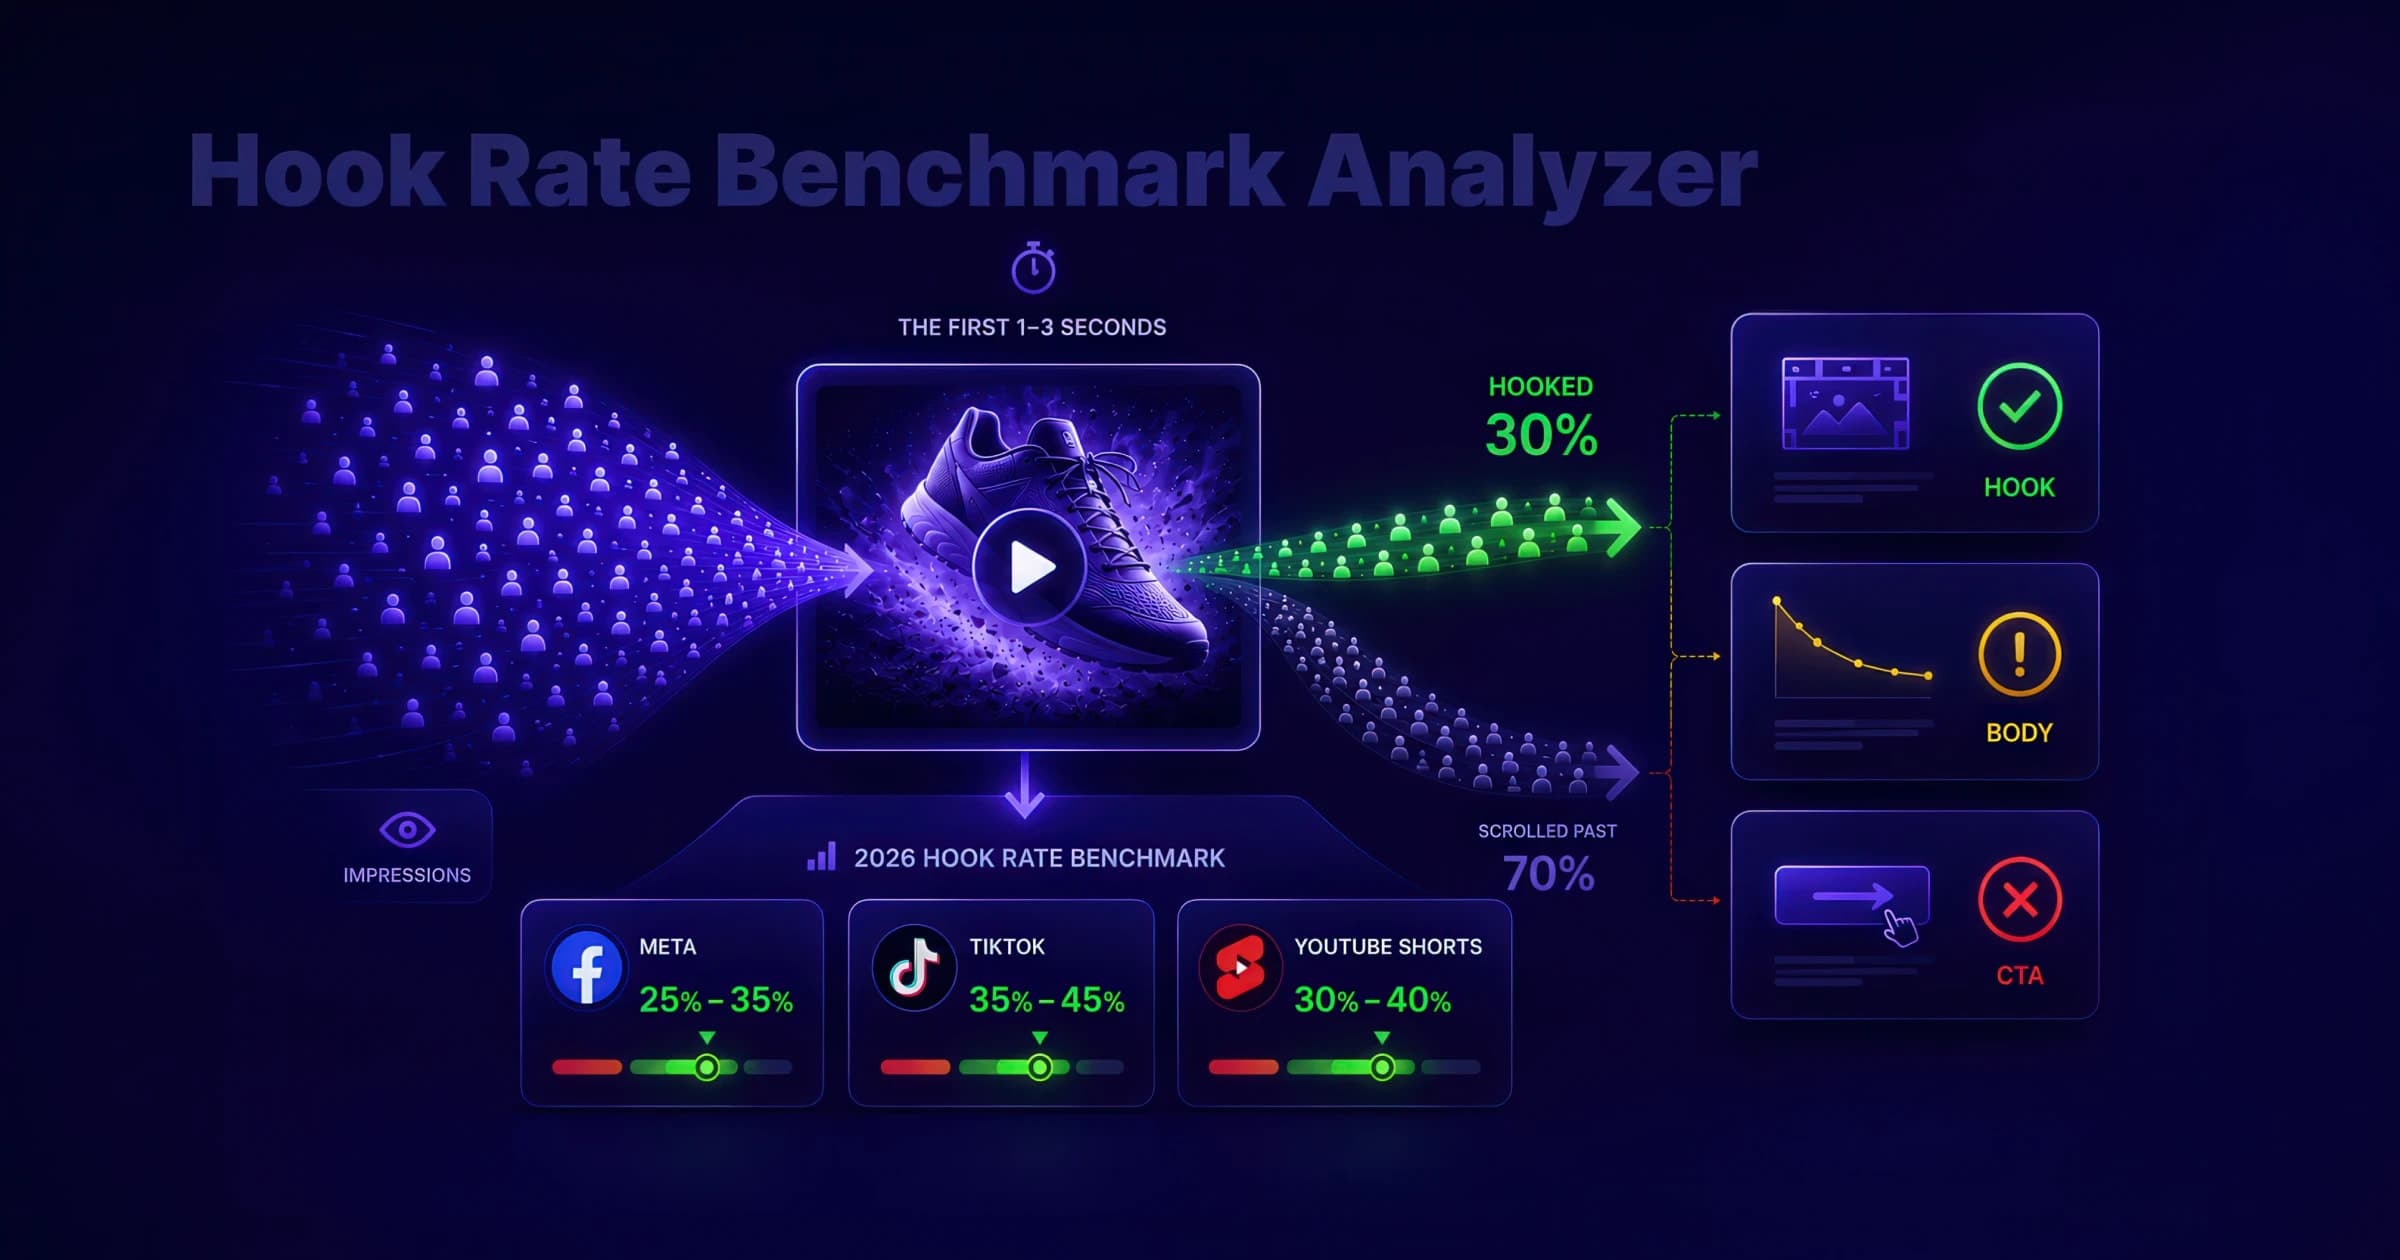
Calculate hook rate (thumbstop rate) for Meta, TikTok, and YouTube Shorts, compare it to 2026 benchmark ranges, and diagnose whether your video ad needs a stronger first frame, tighter body, or clearer CTA.
Related Terms
Creative Testing
Creative testing is a data-driven methodology for evaluating different versions of ad creative elements through controlled experiments to determine which combinations drive the best performance. This includes testing variations in images, videos, copy, calls-to-action, layouts, and other creative elements while maintaining scientific rigor through proper sample sizes, control groups, and statistical validation.
Churn Rate
Churn rate measures the proportion of customers who discontinue their relationship with a company during a specific timeframe. For subscription businesses, this means cancellations or non-renewals. For non-subscription businesses, churn is often defined as no purchase activity within a set period. It's a critical metric for evaluating customer retention and business health.
Sample Size
Sample size refers to the number of observations or data points collected in a sample, and is a crucial factor in determining the precision of statistical estimates. In advertising, it directly impacts the confidence, reliability, and validity of metrics such as conversion rates, click-through rates, and return on ad spend (ROAS). The larger the sample size, the more reliable the results, as smaller samples can lead to more variability and less confidence in the conclusions drawn from the data.
