
Guide
Benchmarks & how to read your result
How to read and act on your result — research-backed context with linked sources for every benchmark cited.
How the Calculator Works
Our A/B Test Significance Calculator analyzes your test data to determine:
- Statistical Significance Level: Confidence that results are not due to chance
- Relative Improvement: Percentage improvement of variant over control
- Sample Size Recommendations: Optimal sample size for reliable results
- Test Duration Guidance: How long to run your test
Understanding Test Results
Statistical Significance Levels
- Conclusive (95%+): High confidence - results are statistically significant
- Trending (90-94%): Moderate confidence - results show promise but need more data
- Inconclusive (<90%): Low confidence - results may be due to chance
Relative Improvement
The percentage improvement shows how much better (or worse) your variant performed compared to the control. This helps you understand the practical impact of your changes.
Test Duration Guidelines
Minimum Test Duration
Run your test until you reach statistical significance or the recommended sample size. However, ensure you run it for at least one full business cycle to account for daily/weekly variations. For most businesses, this means at least 1-2 weeks, even if you reach significance earlier.
Factors Influencing Test Duration
- Traffic Volume: Higher traffic = faster results
- Conversion Rates: Higher conversion rates = smaller sample sizes needed
- Minimum Detectable Effect: Smaller changes require larger sample sizes
- Business Cycles: Account for weekly/monthly patterns
Sample Size Requirements
Approximate visitors per variant for 95% confidence at 80% power (two-sided test). Double for control + variant combined.
1%
- Detect +5% relative
- ~636,000
- Detect +10% relative
- ~163,000
- Detect +20% relative
- ~43,000
2%
- Detect +5% relative
- ~315,000
- Detect +10% relative
- ~81,000
- Detect +20% relative
- ~21,000
5%
- Detect +5% relative
- ~122,000
- Detect +10% relative
- ~31,000
- Detect +20% relative
- ~8,100
10%
- Detect +5% relative
- ~58,000
- Detect +10% relative
- ~15,000
- Detect +20% relative
- ~3,800
| Baseline conversion rate | Detect +5% relative | Detect +10% relative | Detect +20% relative |
|---|---|---|---|
| 1% | ~636,000 | ~163,000 | ~43,000 |
| 2% | ~315,000 | ~81,000 | ~21,000 |
| 5% | ~122,000 | ~31,000 | ~8,100 |
| 10% | ~58,000 | ~15,000 | ~3,800 |
Understanding Uplift
What's a Good Uplift?
A good uplift varies by what you're testing:
- Small Changes: 1-5% uplift (button colors, minor copy changes)
- Medium Changes: 5-15% uplift (headlines, form layouts)
- Major Changes: 15%+ uplift (complete redesigns, new features)
Context Matters
Focus on statistical significance rather than just the uplift percentage. Consider the context:
- A 2% uplift in a checkout flow for a high-volume e-commerce site could translate to substantial revenue
- A 15% uplift on a low-traffic page might have less business impact
- Consider the cumulative effect of multiple small improvements over time
Common Testing Mistakes
Early Stopping (Peeking)
Problem: Stopping tests early when you see significant results Solution: Wait until you reach your predetermined sample size or significance threshold Why: Early stopping increases the risk of Type I errors (false positives)
Insufficient Sample Size
Problem: Running tests with too few visitors/conversions Solution: Use the calculator to determine required sample size before starting Why: Small sample sizes lead to unreliable results and false conclusions
Multiple Testing Without Correction
Problem: Running multiple tests simultaneously without adjusting significance levels Solution: Use Bonferroni correction or sequential testing methods Why: Multiple tests increase the chance of false positives
Ignoring Business Cycles
Problem: Not accounting for weekly/monthly patterns in your data Solution: Run tests for at least one full business cycle Why: Traffic and conversion patterns vary by day of week and season
Methodology & sources
Sample-size tables use a two-sided test at 95% confidence and 80% statistical power — the default for A/B tests where the variant could beat or lose to control. Relative lift is defined as a percentage change from baseline (5% → 5.5% = +10% relative, not +0.5 percentage points).
Evan Miller Sample Size Calculator
Two-proportion test reference
Optimizely Stats Engine documentation
Peeking, sequential testing, and power guidance
Google Optimize / Experimentation best practices
Minimum run duration and business-cycle guidance
See also Statistical significance in the glossary
A/B Test Significance Calculator
Make data-driven decisions with our A/B test significance calculator. Analyze test results with statistical rigor, determine confidence levels, and get actionable recommendations for test duration and sample size requirements.
Free Calculator
No sign up required. Use this calculator as much as you need.
Stop calculating by hand
Want AI to track this across every creative variant — and tie it back to ROAS automatically? That’s what AdSights does.
Request early accessRelated Calculators

Creative Testing Budget Calculator
Plan your creative testing budget effectively with our comprehensive calculator. Get expert recommendations for test duration, sample size, and budget allocation to ensure statistically significant results.
UGC Cost Calculator
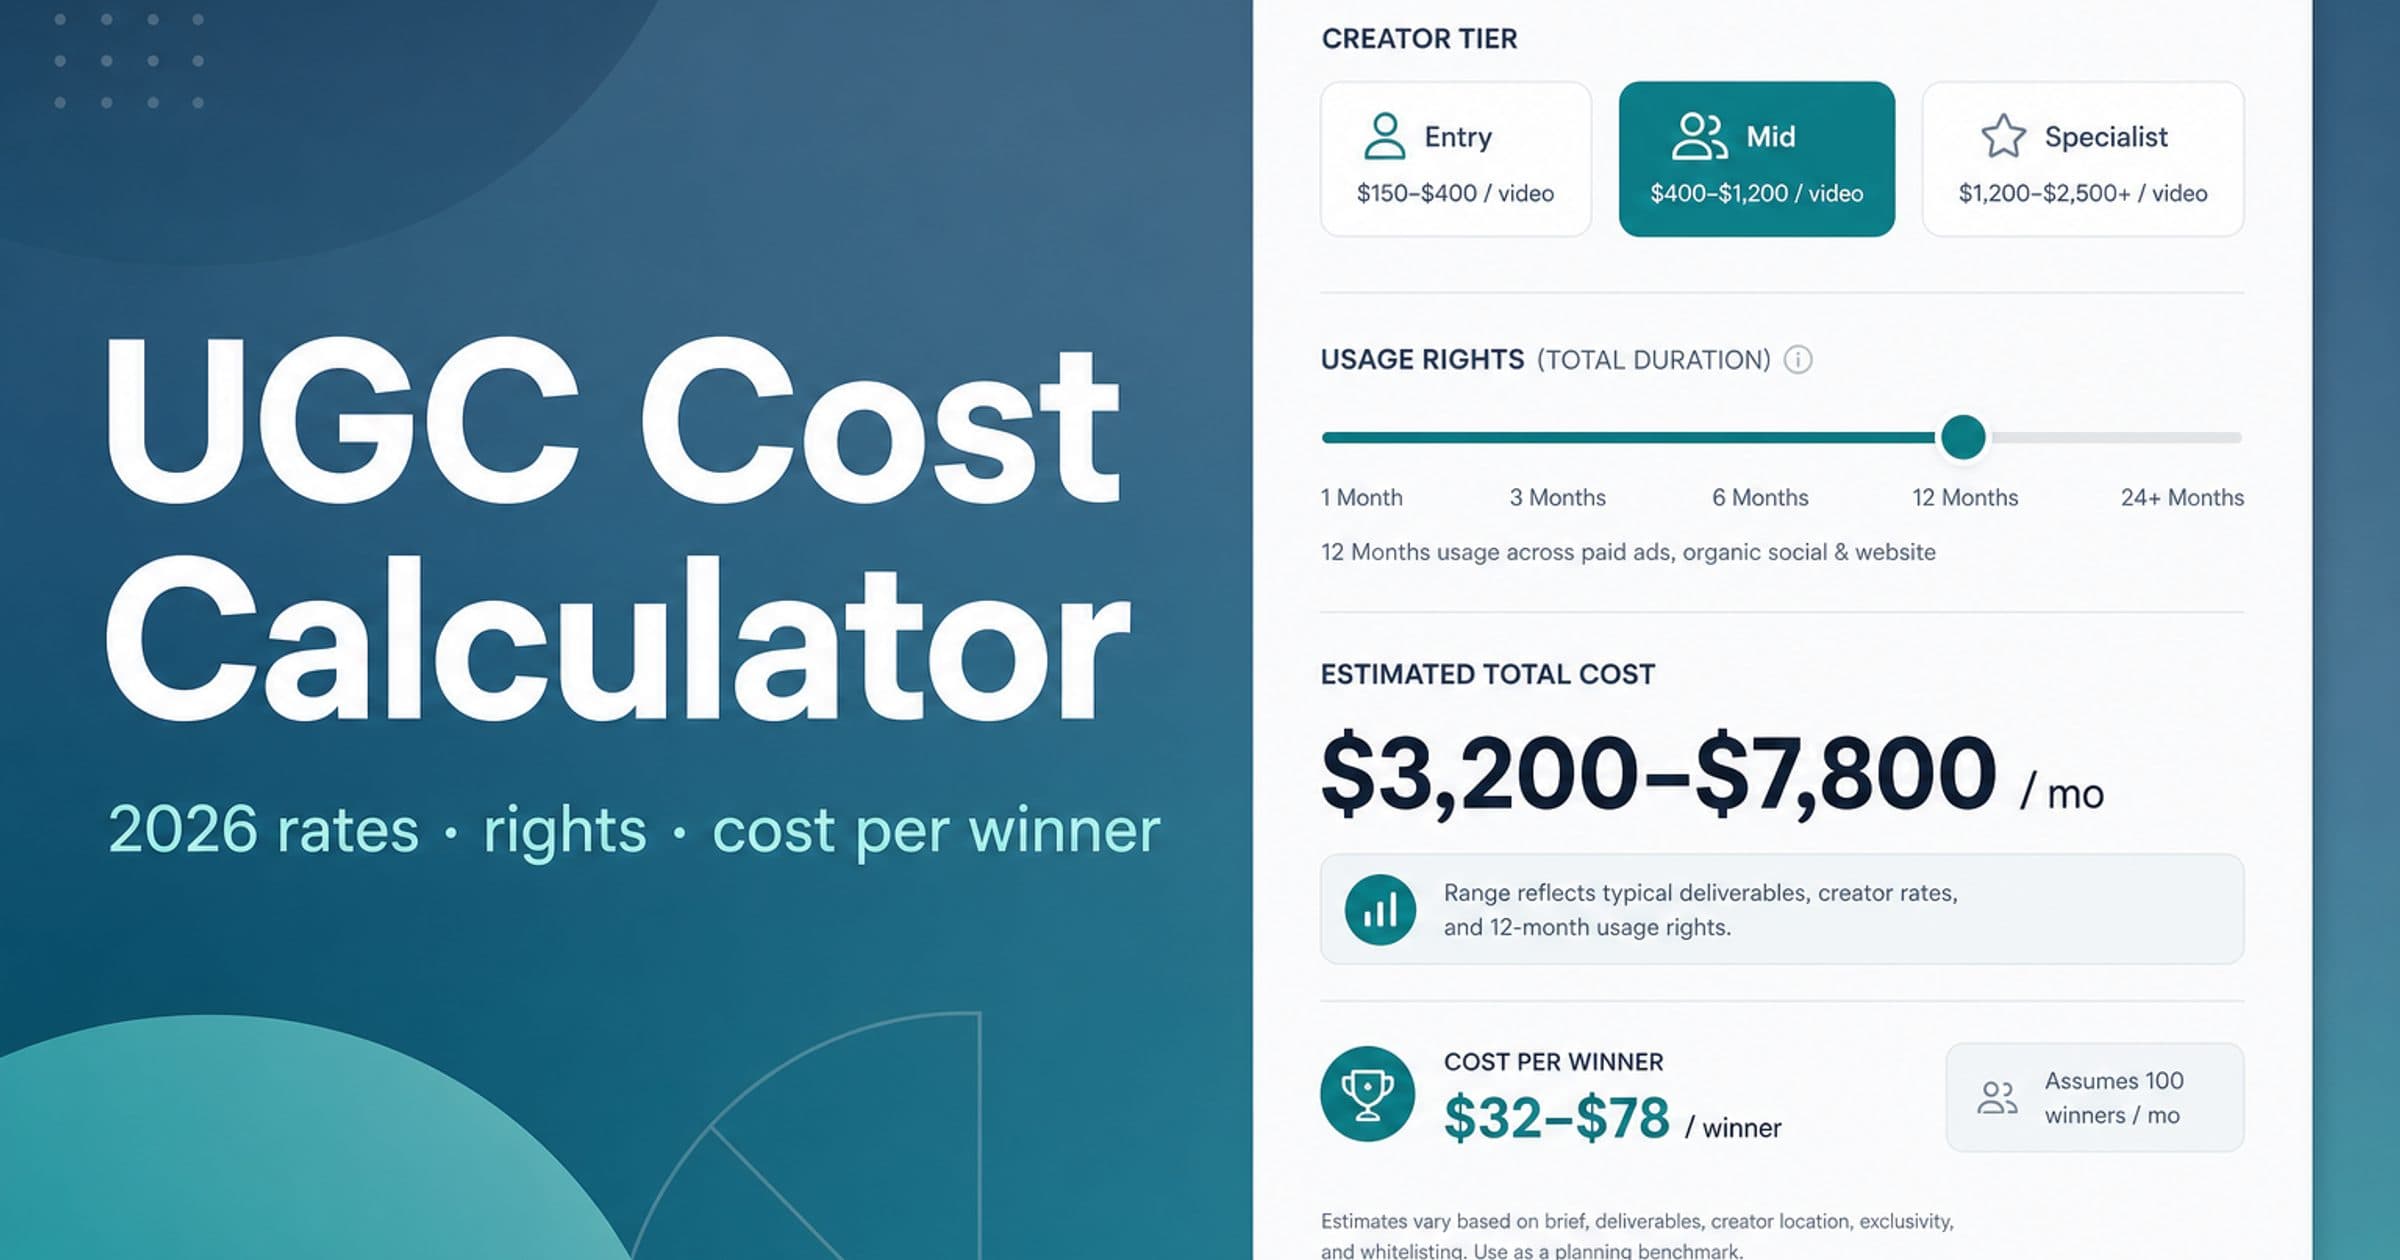
Free UGC cost calculator with independently researched 2026 creator rates, paid usage-rights uplifts, whitelisting, niche premiums, DIY vs agency vs hybrid AI paths, and cost-per-winner framing. Export your scenario to CSV.

Incrementality Calculator
Measure the true impact of your marketing campaigns by calculating incrementality. Understand which portion of your conversions would have happened organically versus those directly caused by your marketing efforts.

Related Terms
Sample Size
Sample size refers to the number of observations or data points collected in a sample, and is a crucial factor in determining the precision of statistical estimates. In advertising, it directly impacts the confidence, reliability, and validity of metrics such as conversion rates, click-through rates, and return on ad spend (ROAS). The larger the sample size, the more reliable the results, as smaller samples can lead to more variability and less confidence in the conclusions drawn from the data.
Statistical Significance
Statistical significance indicates whether an observed difference between variants in an experiment is likely to be due to random chance or represents a genuine effect. In advertising, it helps determine if differences in key metrics like CTR, conversion rate, or ROAS between ad variants or campaigns represent real performance differences rather than random fluctuations. This is crucial for making data-driven optimization decisions and avoiding false conclusions based on temporary variations.
A/B Testing
A/B testing is a scientific method of creative optimization where exactly two versions of an ad are compared, with only one element varied while all others remain constant. This controlled approach enables marketers to isolate and quantify the impact of specific creative elements on performance metrics. Unlike multi-variate testing, A/B testing provides clear causation insights about individual elements while requiring less traffic volume for statistical significance.
