
Methodology & sources
Lift percentages assume randomized test/control design with a single marketing exposure difference. Sample-size guidance uses one-sided tests (treatment must beat control) — roughly 20% smaller per group than the two-sided A/B tables in our significance calculator for the same baseline and lift.
PSA and ghost-ad holdout methodology
Randomized controlled campaign tests
Nielsen Marketing Mix Modeling
Geo-holdout and incrementality context
Causal measurement vs attribution frameworks
See also Incrementality and Incrementality testing in the glossary
Marketing Incrementality Calculator
Measure the true impact of your marketing campaigns by calculating incrementality. Understand which portion of your conversions would have happened organically versus those directly caused by your marketing efforts.
Free Calculator
No sign up required. Use this calculator as much as you need.
Stop calculating by hand
Want AI to track this across every creative variant — and tie it back to ROAS automatically? That’s what AdSights does.
Request early accessRelated Calculators

CPA Calculator
Free CPA calculator: realized cost per acquisition from spend and conversions, funnel CPA from CPC or CPM × CTR × CVR, break-even CPA from margin, target CAC from LTV, and target CPA from ROAS — with cited 2026 lead-CPL and ecommerce-purchase bands. CSV export. No sign-up.

ROAS Calculator
Calculate and analyze your return on ad spend (ROAS) to optimize campaign performance. Get data-driven insights on advertising efficiency, revenue attribution, and budget allocation to maximize marketing ROI.

MER Calculator
Calculate Marketing Efficiency Ratio (MER) metrics to evaluate overall marketing performance, attributed efficiency, and new customer acquisition. Use our free MER calculator to apply multiple MER formulas (MER, aMER, nMER), analyze key efficiency metrics, and optimize your marketing ROI with data-driven insights.
Related Analyzers
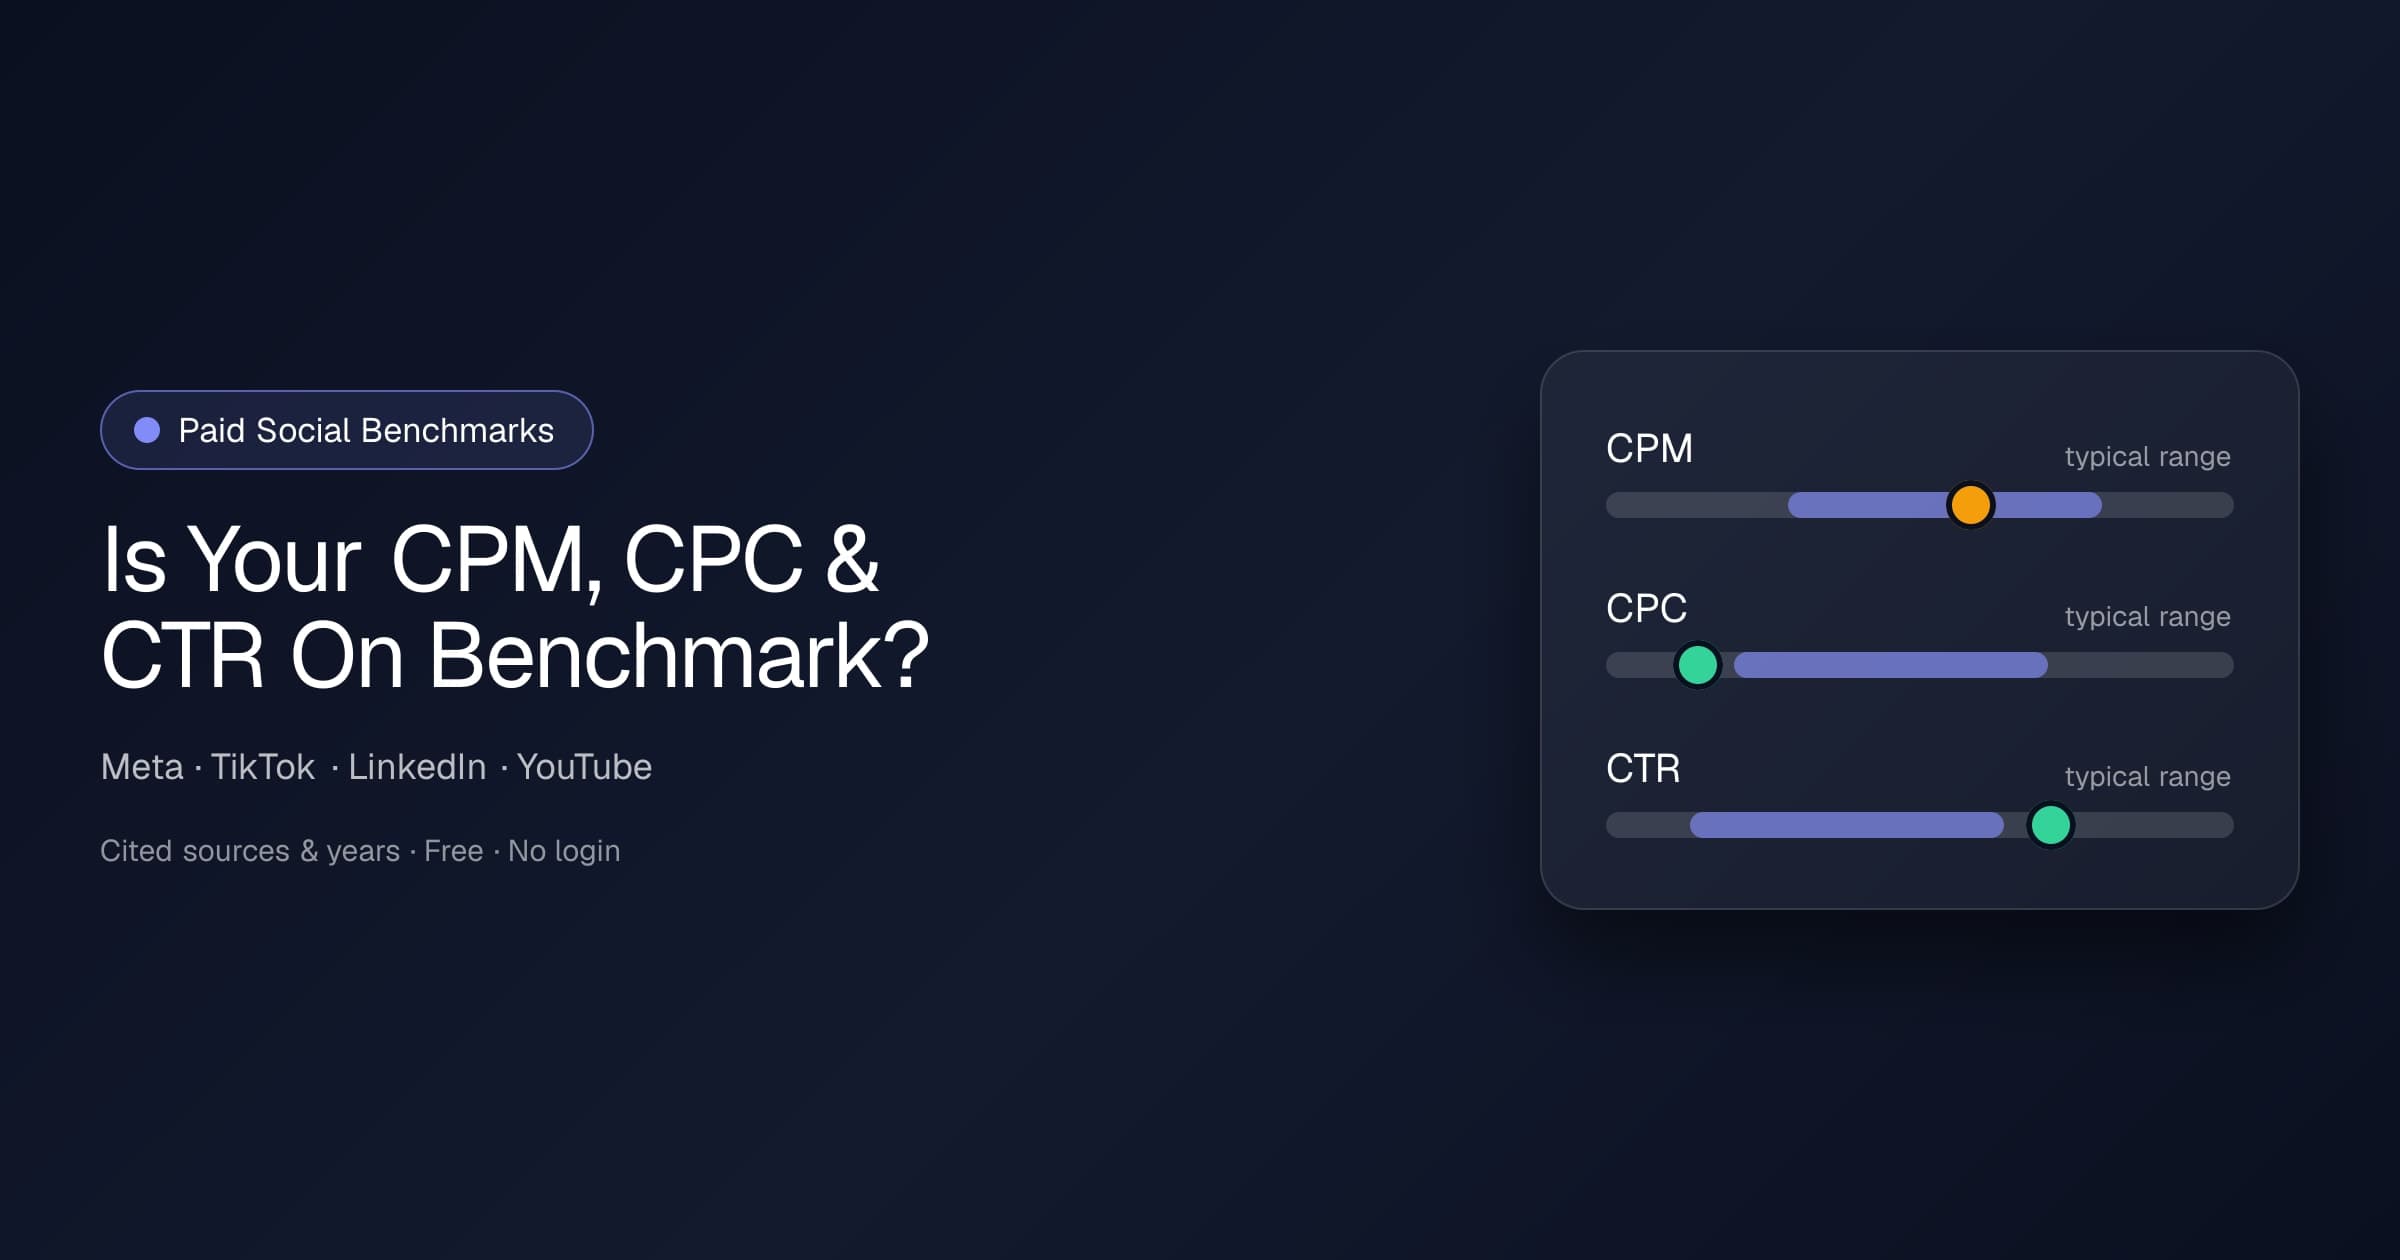
Paid Social Benchmarks
Enter your CPM, CPC, or CTR and see how it compares to current published benchmarks for Meta, TikTok, LinkedIn, and YouTube — segmented by campaign objective where the source splits them. Free, no login, every figure cited with source and year.
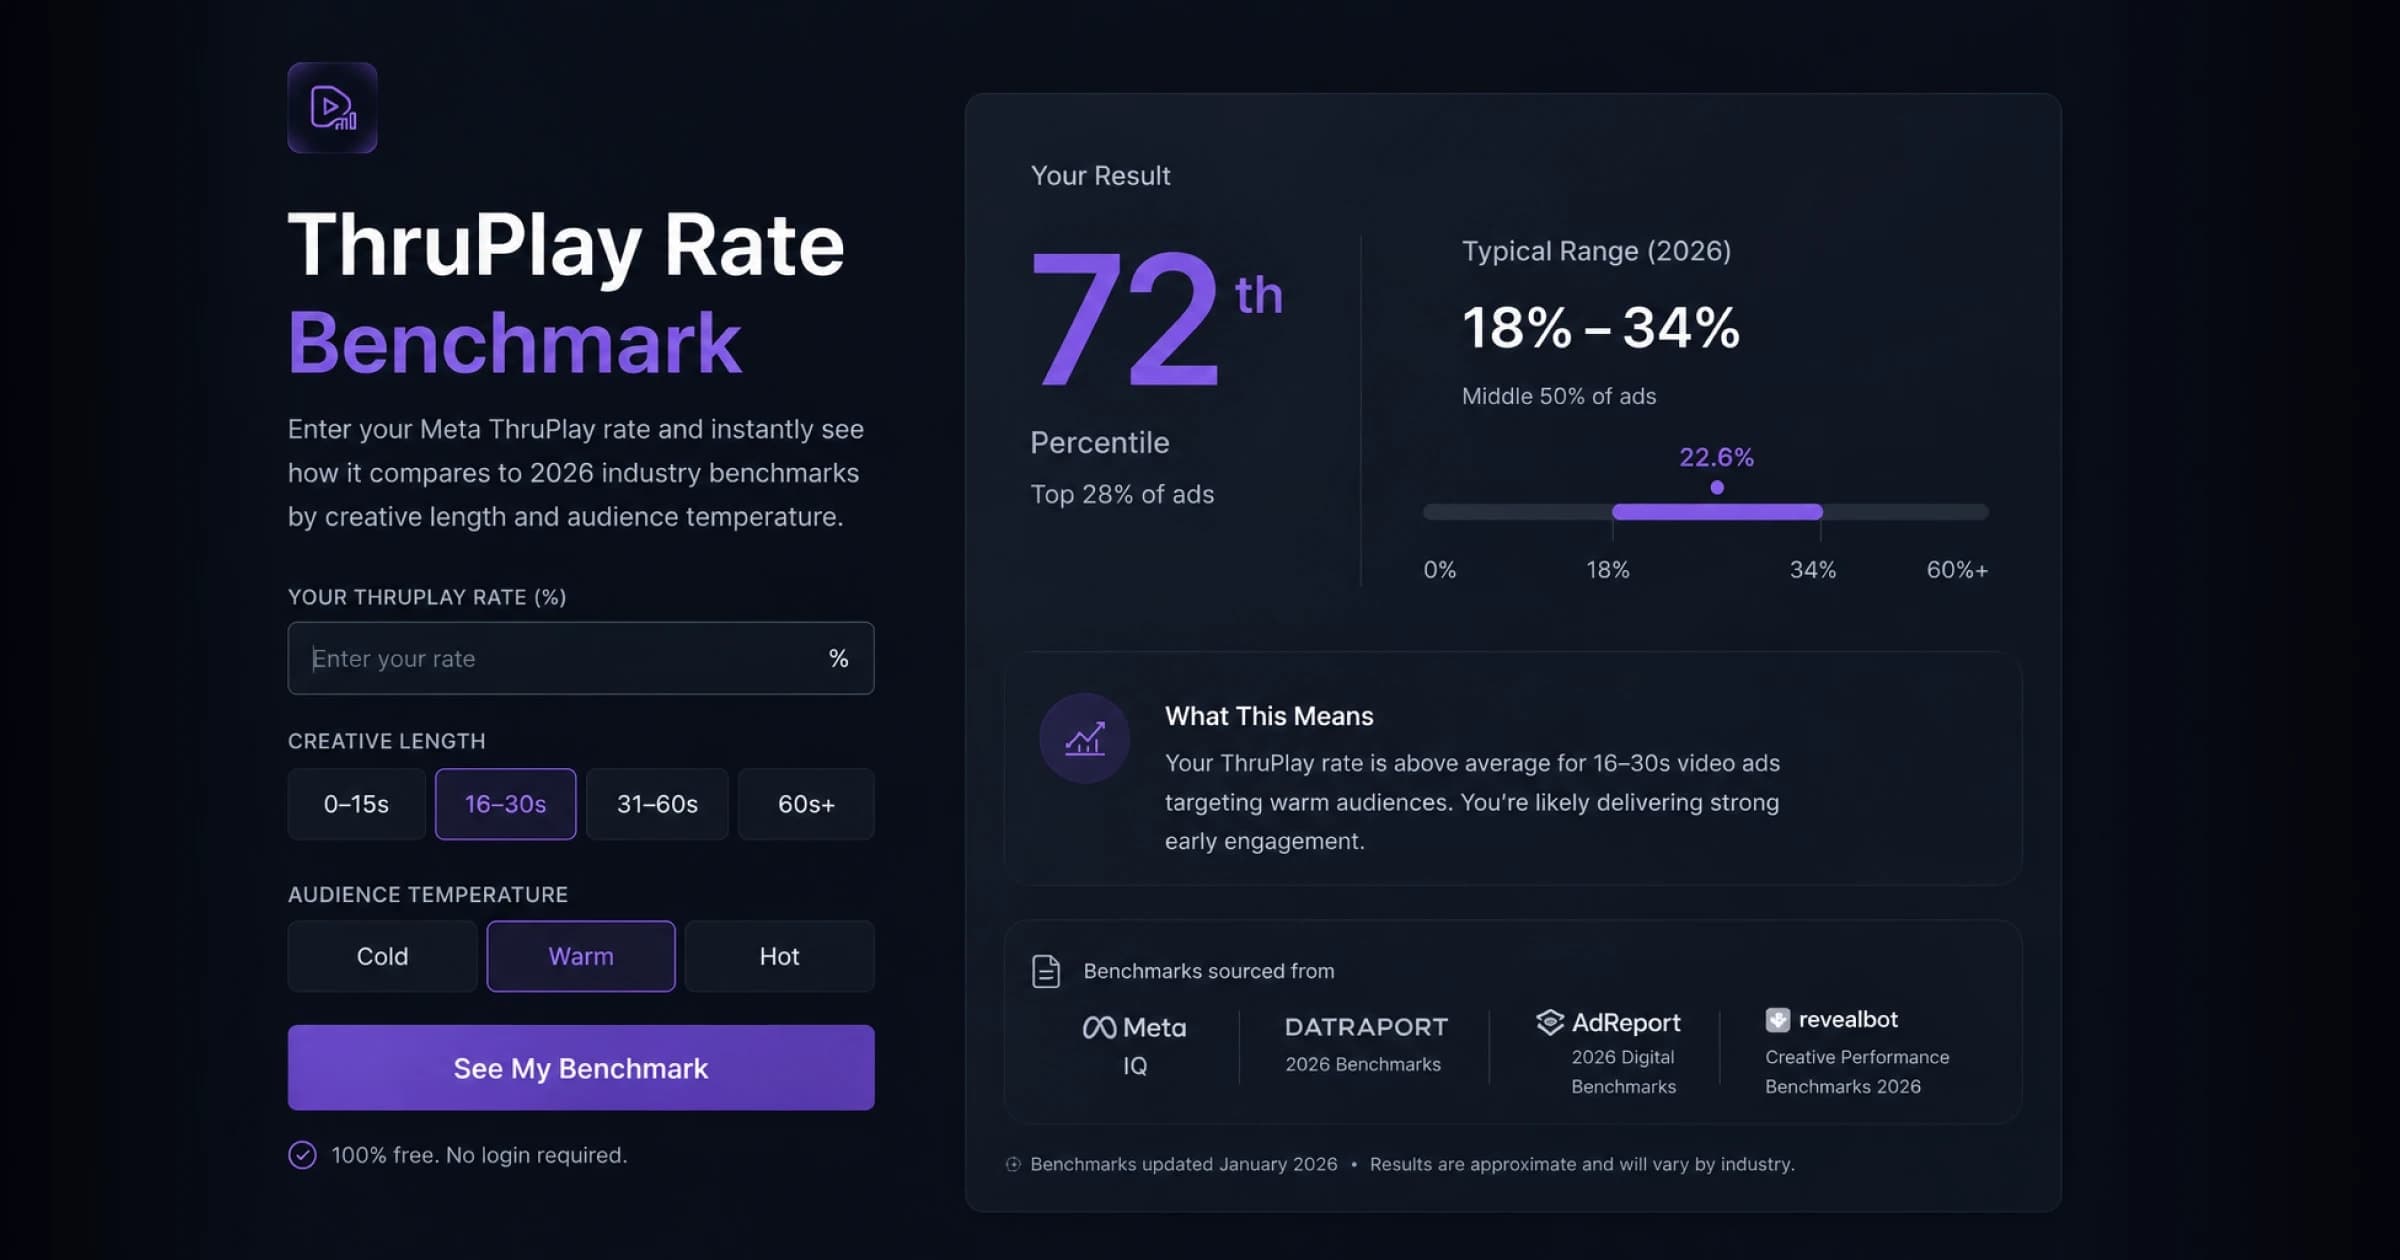
ThruPlay Rate Benchmark
Enter your Meta ThruPlay rate and instantly see how it compares to 2026 industry benchmarks by creative length and audience temperature. Free, no login — see where you land vs the cited typical range, with sources, and what your number means for creative performance.
Related Terms
Incrementality
Incrementality is a scientific measurement approach that determines the true incremental value generated by a marketing activity by comparing outcomes against a statistically valid control group. Unlike basic attribution models, incrementality testing uses randomized controlled trials and sophisticated causal inference techniques to identify what would have happened without the marketing intervention, enabling marketers to understand the real marginal impact of their spending and optimize toward truly incremental growth.
Churn Rate
Churn rate measures the proportion of customers who discontinue their relationship with a company during a specific timeframe. For subscription businesses, this means cancellations or non-renewals. For non-subscription businesses, churn is often defined as no purchase activity within a set period. It's a critical metric for evaluating customer retention and business health.
Control Group
A control group is a randomly selected segment of users or data points that receive no experimental treatment, serving as the baseline against which test groups are measured. In marketing experimentation, control groups enable marketers to isolate the true causal impact of campaigns, creative changes, or other interventions by comparing outcomes between exposed and unexposed audiences under otherwise identical conditions.
