
Guide
Benchmarks & how to read your result
How to read and act on your result — research-backed context with linked sources for every benchmark cited.
How LTV is Calculated
LTV is calculated by multiplying the average purchase value by the purchase frequency and customer lifespan. This gives you the gross LTV, which can be adjusted for profit margins and acquisition costs to get the net LTV.
Formula: LTV = (Average Purchase Value × Purchase Frequency × Customer Lifespan) × Profit Margin
For more accurate calculations, you can also factor in discount rates to account for the time value of money.
LTV to CAC Ratio
What's a Good LTV to CAC Ratio?
A healthy LTV to CAC (Customer Acquisition Cost) ratio is typically 3:1 or higher. This means you earn at least 3 times what you spend to acquire a customer, ensuring sustainable growth.
Industry Benchmarks
A 3:1 LTV:CAC ratio is the widely cited target — for every $1 of acquisition cost you recover at least $3 of lifetime value. The median B2B SaaS company runs about 3.2:1, and benchmarks vary by model:
B2B SaaS
- Target LTV:CAC
- 4:1 (median ~3.2:1)
- Notes
- 4:1+ signals a strong, scalable model; below 3:1 usually means CAC is too high or retention too low
B2C SaaS
- Target LTV:CAC
- ~2.5:1
- Notes
- Higher volume and lower price points compress the ratio
EdTech
- Target LTV:CAC
- ~5:1
- Notes
- Long usage lifespans lift LTV
E-commerce
- Target LTV:CAC
- 4:1 or higher
- Notes
- Repeat-purchase and replenishment categories sit at the top of the range
Early-stage startups
- Target LTV:CAC
- May run below 3:1 temporarily
- Notes
- Acceptable while establishing the market, but plan a path back above 3:1
| Business model | Target LTV:CAC | Notes |
|---|---|---|
| B2B SaaS | 4:1 (median ~3.2:1) | 4:1+ signals a strong, scalable model; below 3:1 usually means CAC is too high or retention too low |
| B2C SaaS | ~2.5:1 | Higher volume and lower price points compress the ratio |
| EdTech | ~5:1 | Long usage lifespans lift LTV |
| E-commerce | 4:1 or higher | Repeat-purchase and replenishment categories sit at the top of the range |
| Early-stage startups | May run below 3:1 temporarily | Acceptable while establishing the market, but plan a path back above 3:1 |
A ratio that climbs well above your model's target — for most SaaS that means roughly 6:1 or higher — can signal underinvestment in growth: you may be able to spend more to acquire customers and still stay efficient. (Category targets differ, so judge "too high" against the model's benchmark above, not a single universal number — EdTech's ~5:1, driven by long usage lifespans, is healthy, not excessive.) (Sources: Optifai B2B SaaS LTV benchmarks 2025; Phoenix Strategy Group; Proven SaaS CAC Benchmarks 2025.)
Payback Period — the other half of the ratio
For cash-constrained businesses, CAC payback period matters as much as the absolute ratio: a 3:1 ratio that takes 30 months to recoup ties up cash far longer than a 3:1 with a 9-month payback. Typical 2025 targets: < 12 months for SMB, < 18 months for mid-market, and < 24 months for enterprise; scale-stage companies above $10M ARR often reach 80–120 day paybacks. Track payback alongside LTV:CAC so a healthy-looking ratio doesn't hide a cash-flow problem. (Sources: Proven SaaS 2025; Phoenix Strategy Group.)
Calculating LTV:CAC Ratio
LTV:CAC Ratio = Customer Lifetime Value ÷ Customer Acquisition Cost
Improving Customer LTV
Three Main Levers
- Increase Purchase Frequency: Through engagement and retention strategies
- Increase Average Purchase Value: Through upselling and cross-selling
- Extend Customer Lifespan: Through better customer service and loyalty programs
Specific Strategies
Increase Purchase Frequency
- Subscription Models: Convert one-time buyers to subscribers
- Loyalty Programs: Reward repeat purchases
- Email Marketing: Regular engagement and offers
- Personalization: Tailored product recommendations
Increase Average Purchase Value
- Upselling: Offer premium versions or add-ons
- Cross-selling: Suggest complementary products
- Bundle Deals: Package related products together
- Dynamic Pricing: Optimize pricing based on customer behavior
Extend Customer Lifespan
- Customer Success Programs: Ensure customers get maximum value
- Proactive Support: Address issues before they become problems
- Community Building: Create engagement beyond transactions
- Feedback Loops: Continuously improve based on customer input
Churn Rate Impact on LTV
How Churn Affects LTV
Churn rate directly impacts LTV by affecting customer lifespan. A high churn rate means customers leave sooner, reducing their lifetime value. Even small improvements in retention can significantly increase LTV.
Example Impact
Reducing monthly churn from 5% to 4% increases the average customer lifespan from 20 months to 25 months, potentially increasing LTV by 25%.
Churn Reduction Strategies
- Onboarding Optimization: Ensure customers see value quickly
- Proactive Support: Address issues before they escalate
- Feature Adoption: Help customers use more features
- Success Metrics: Track and improve key success indicators
Customer Segmentation by LTV
Why Segment LTV?
Yes, LTV should be calculated separately for different customer segments whenever possible. Different customer groups often have vastly different purchasing behaviors, retention rates, and profitability.
Segmentation Criteria
- Acquisition Channel: How customers found your business
- Demographics: Age, location, company size
- Product Usage Patterns: Feature usage, engagement levels
- Customer Size: Enterprise vs. SMB vs. individual
- Geographic Region: Different markets may have different behaviors
Segment-Specific Strategies
- High LTV Segments: Invest more in acquisition and retention
- Low LTV Segments: Focus on efficiency or consider deprioritizing
- Growth Potential Segments: Develop strategies to increase their LTV
Methodology & sources
LTV:CAC targets and payback periods are compiled from SaaS and e-commerce operator benchmarks (2024–2025). Segment LTV separately by acquisition channel — blended averages hide whether paid social or organic cohorts fund growth.
LTV:CAC medians and payback by ARR stage
Phoenix Strategy Group SaaS Metrics
Payback period targets by segment
Product-led expansion and retention context
Optifai B2B SaaS LTV benchmarks
B2B SaaS LTV:CAC reference ranges
See also Customer lifetime value (CLV) in the glossary
Customer Lifetime Value (LTV) Calculator
Maximize your customer relationships with our comprehensive LTV calculator. Analyze customer value over time, identify growth opportunities, and develop data-driven strategies to improve retention and revenue per customer.
Free Calculator
No sign up required. Use this calculator as much as you need.
Stop calculating by hand
Want AI to track this across every creative variant — and tie it back to ROAS automatically? That’s what AdSights does.
Request early accessRelated Calculators

CPA Calculator
Free CPA calculator: realized cost per acquisition from spend and conversions, funnel CPA from CPC or CPM × CTR × CVR, break-even CPA from margin, target CAC from LTV, and target CPA from ROAS — with cited 2026 lead-CPL and ecommerce-purchase bands. CSV export. No sign-up.

Incrementality Calculator
Measure the true impact of your marketing campaigns by calculating incrementality. Understand which portion of your conversions would have happened organically versus those directly caused by your marketing efforts.

MER Calculator
Calculate Marketing Efficiency Ratio (MER) metrics to evaluate overall marketing performance, attributed efficiency, and new customer acquisition. Use our free MER calculator to apply multiple MER formulas (MER, aMER, nMER), analyze key efficiency metrics, and optimize your marketing ROI with data-driven insights.
Related Analyzers
Paid Social Benchmarks
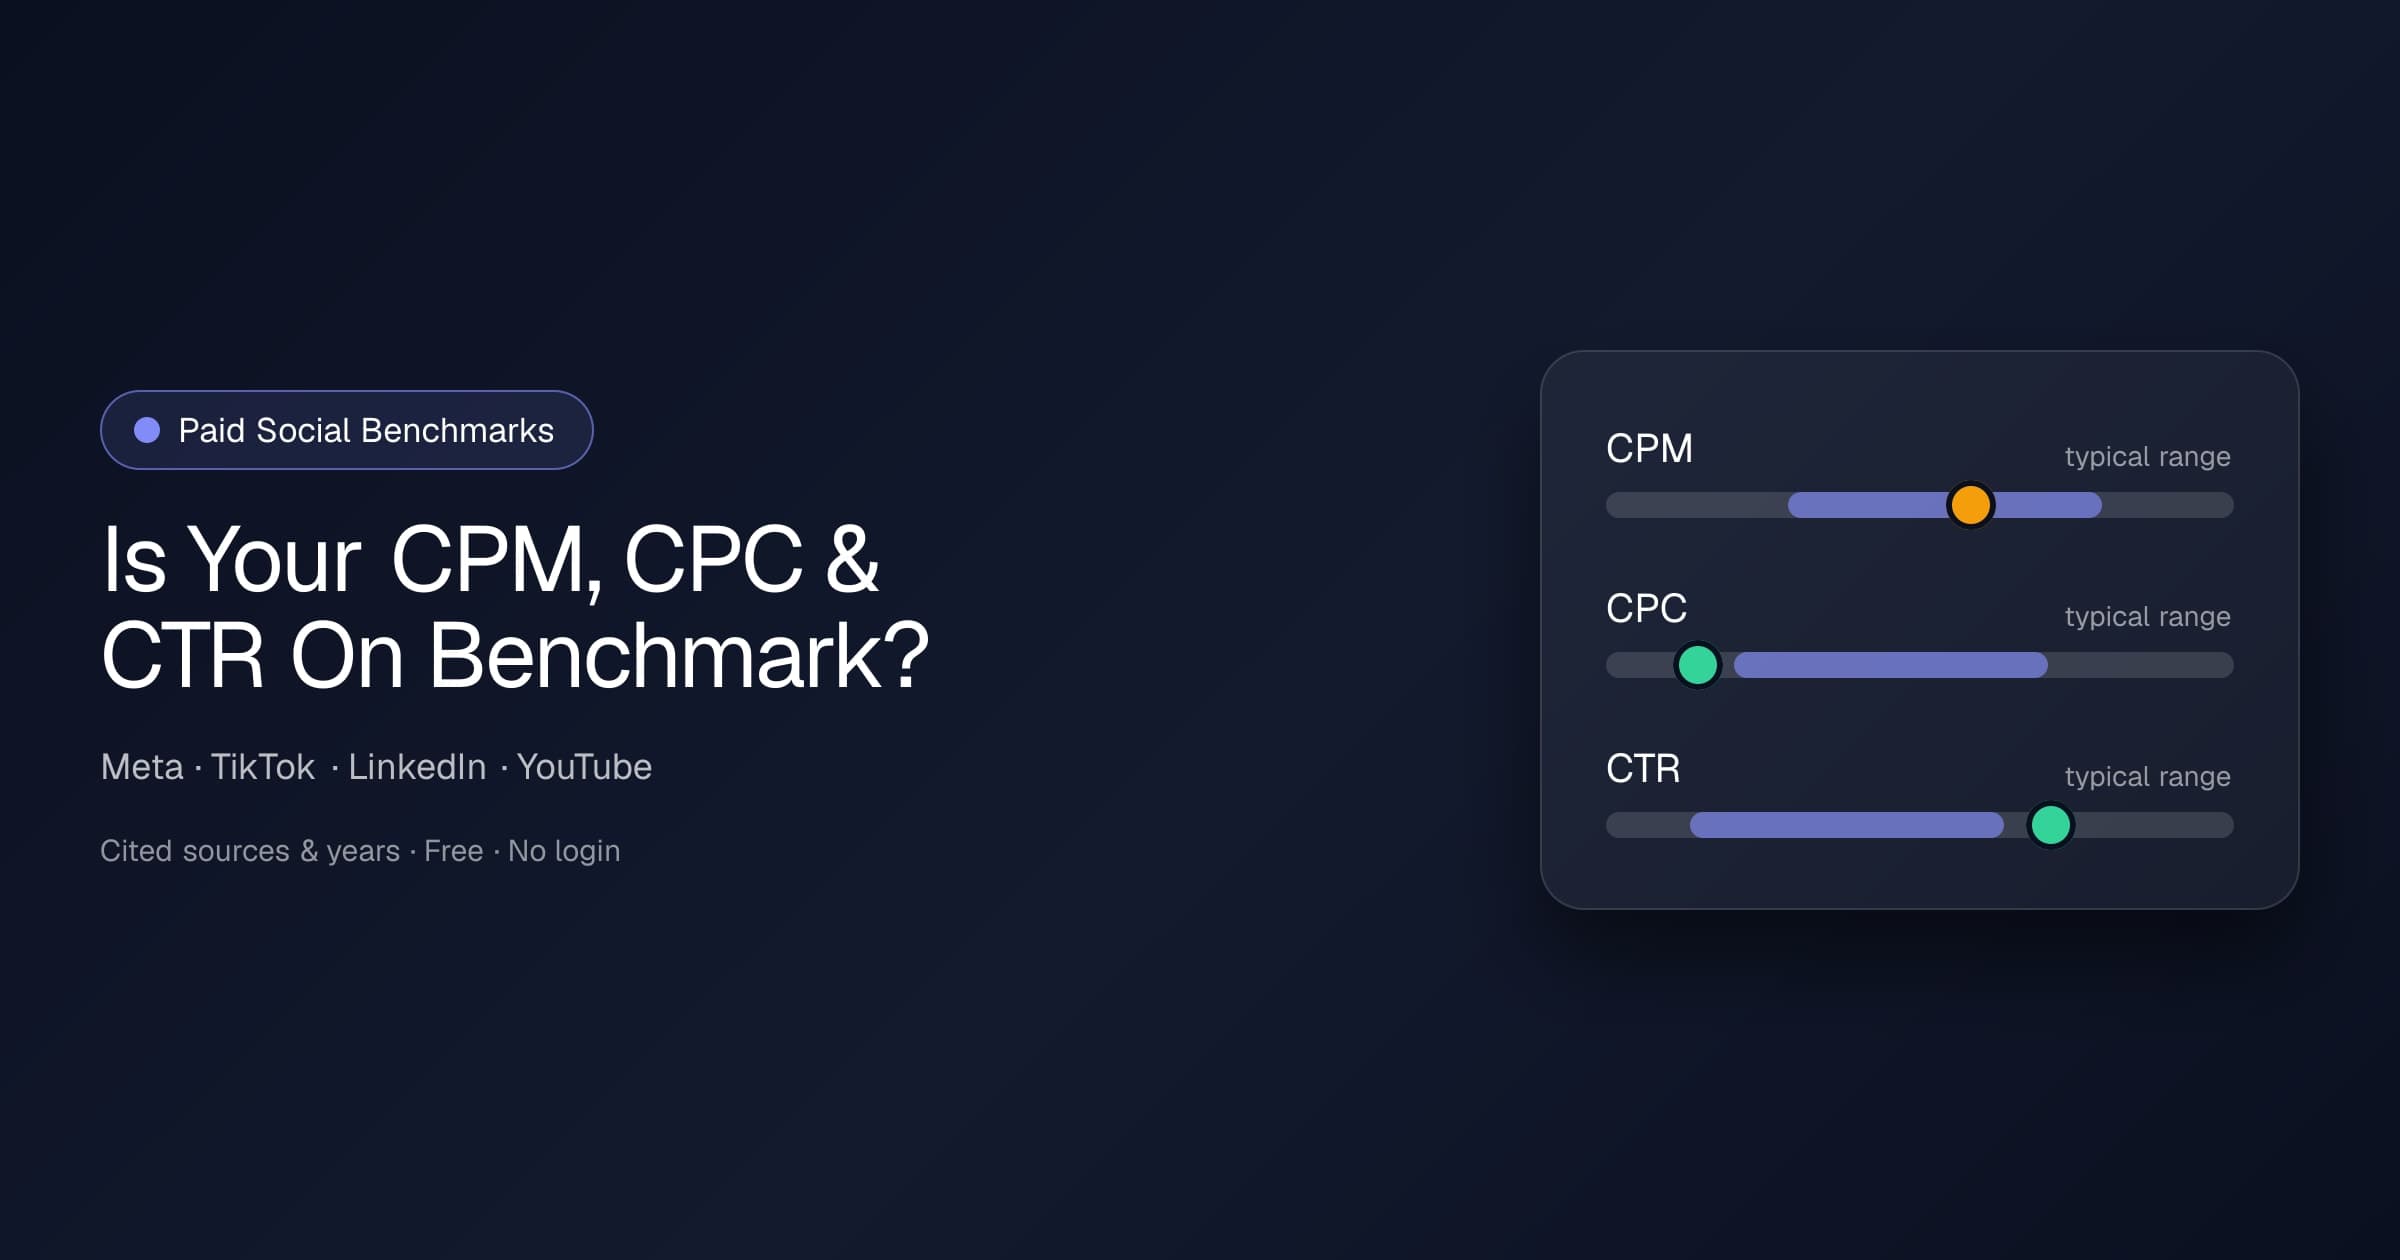
Enter your CPM, CPC, or CTR and see how it compares to current published benchmarks for Meta, TikTok, LinkedIn, and YouTube — segmented by campaign objective where the source splits them. Free, no login, every figure cited with source and year.
ThruPlay Rate Benchmark
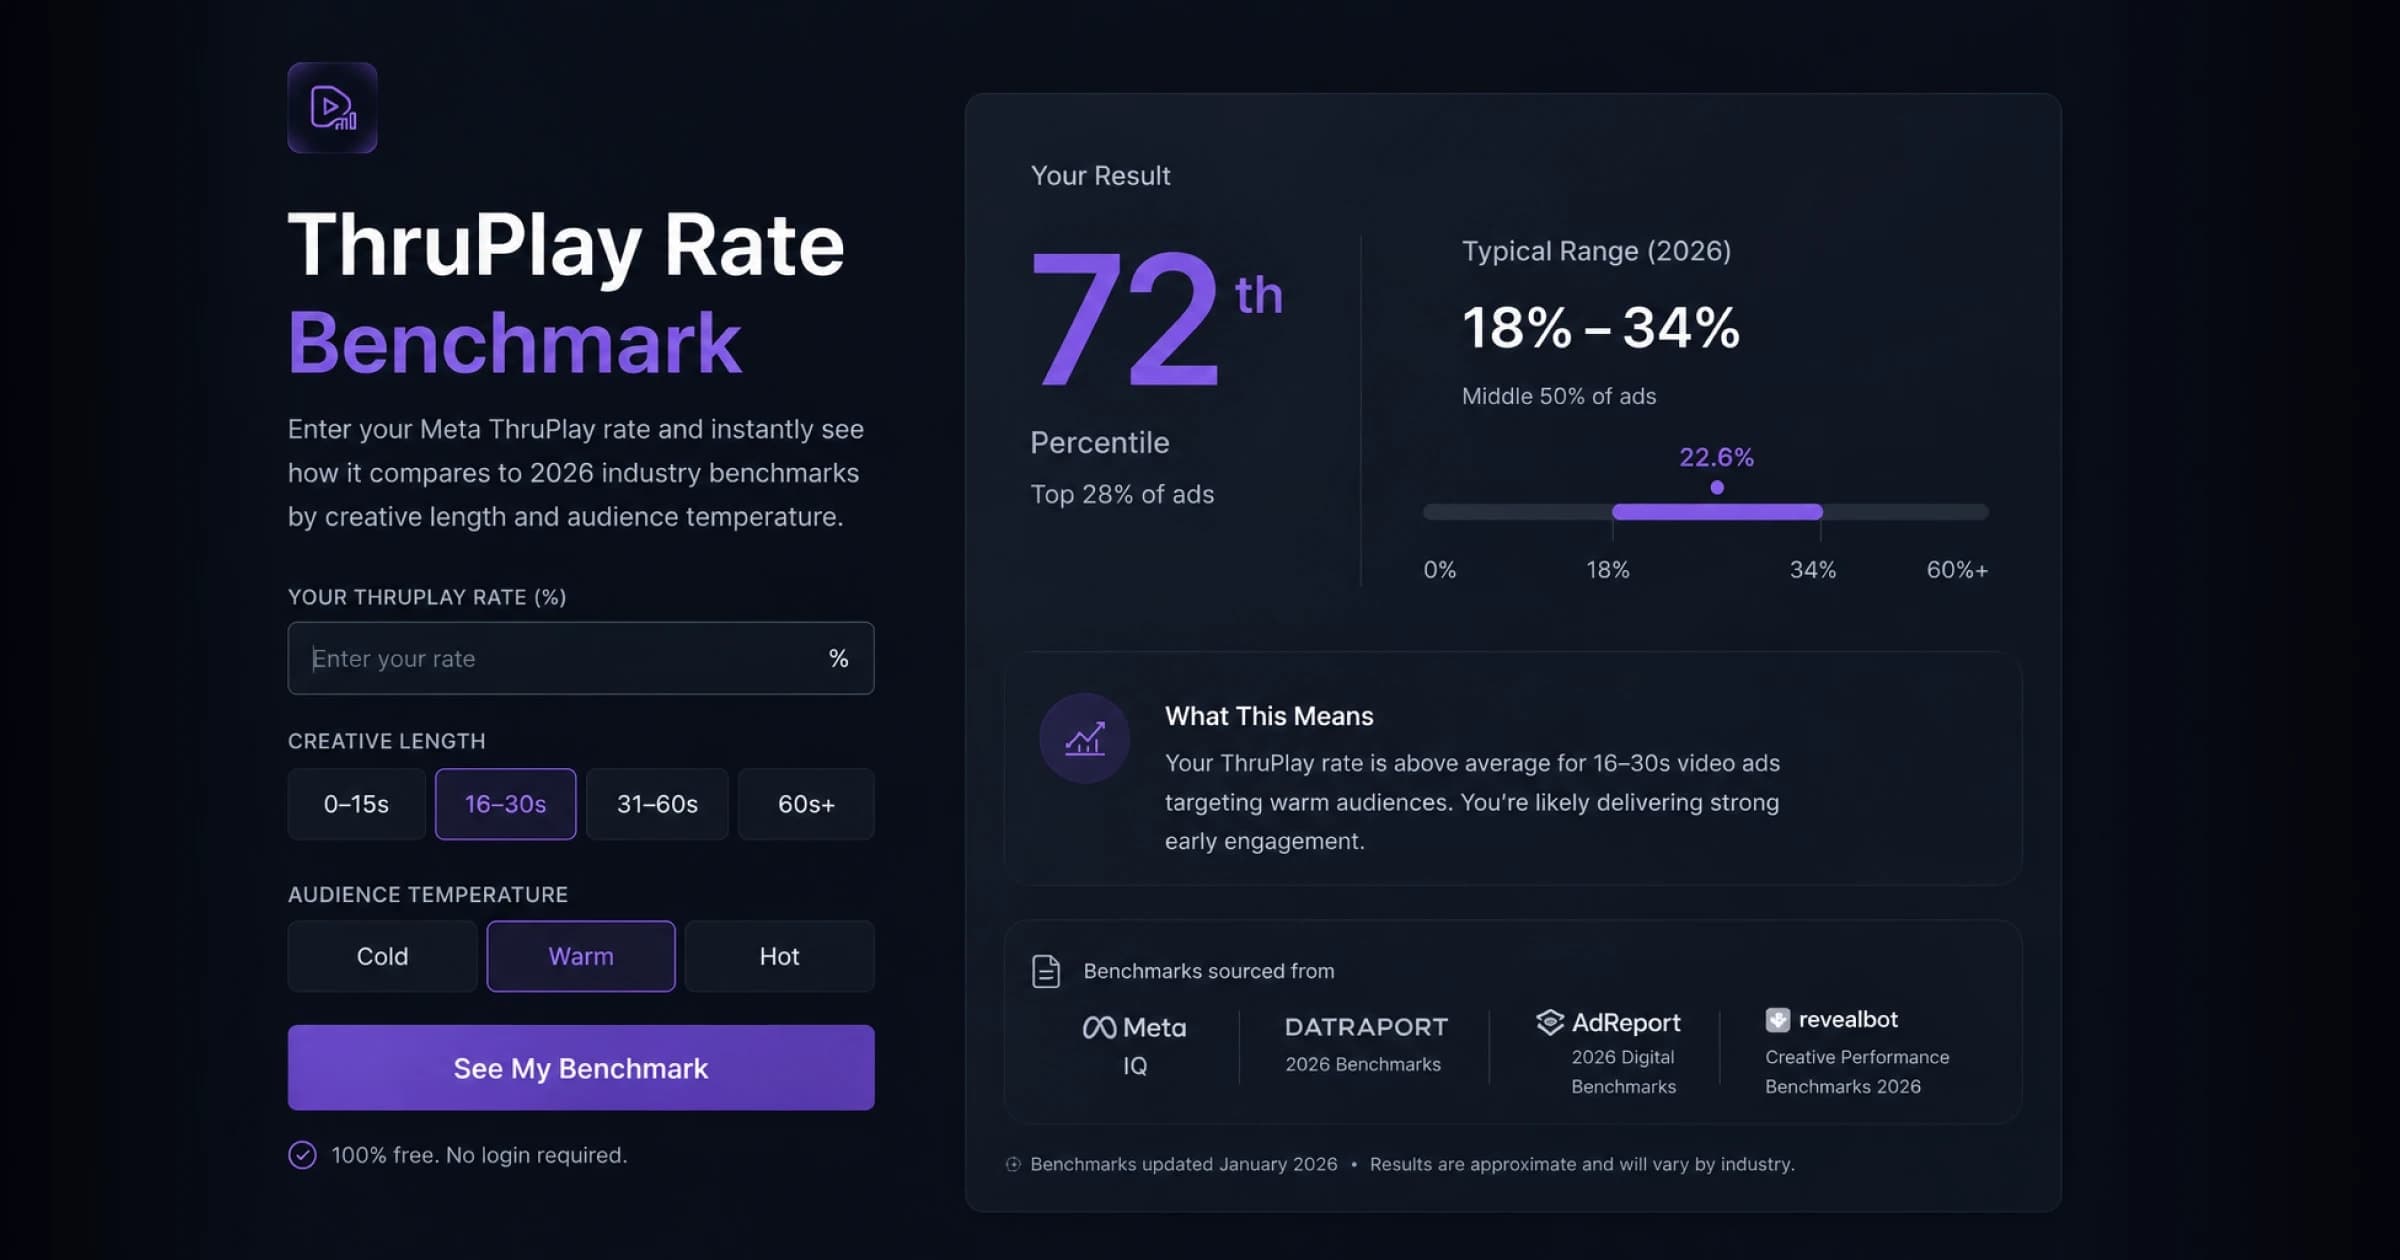
Enter your Meta ThruPlay rate and instantly see how it compares to 2026 industry benchmarks by creative length and audience temperature. Free, no login — see where you land vs the cited typical range, with sources, and what your number means for creative performance.
Related Terms
Marketing Efficiency Ratio
Marketing Efficiency Ratio measures the overall effectiveness of marketing spend by comparing total revenue to total marketing costs. It provides a holistic view of marketing performance across all channels and customer types, including both direct and indirect revenue attribution. Also known as 'blended MER' since it considers all revenue rather than just attributed revenue.
Customer Lifetime Value
Customer Lifetime Value predicts the total revenue a business can expect from a single customer account throughout the entire business relationship. This metric is crucial for determining sustainable customer acquisition costs, optimizing marketing spend, and identifying high-value customer segments. CLV helps businesses make informed decisions about customer acquisition and retention investments.
Moving Average
A moving average is a statistical calculation that creates a series of averages from different subsets of data over time. By recalculating the average over a sliding window — commonly 7 or 28 days for ad data — it separates trend from noise, smoothing out short-term fluctuations and random outliers in metrics like CPC, CTR, or ROAS. Daily platform numbers are often too volatile to act on directly; the moving average is the version you can actually make decisions on.
