
Guide
Benchmarks & how to read your result
How to read and act on your result — research-backed context with linked sources for every benchmark cited.
The CPA formula
CPA = Total Ad Spend ÷ Conversions
- Total Ad Spend — attributed media cost for the period (same account, campaign, or ad set you are judging)
- Conversions — the platform-counted event that spend was optimized for (purchase, lead, trial)
$1,000 spent for 25 purchases = 1,000 ÷ 25 = $40 CPA.
The funnel identities are equivalent restatements of the same number:
- CPA = CPC ÷ conversion rate
- CPA = CPM ÷ (CTR × CVR × 1,000)
A $0.50 CPC at 5% CVR is a $10 CPA. A $10 CPM at 2% CTR and 5% CVR is the same $10 CPA.
How to calculate CPA, step by step
- Pull total spend for the campaign, ad set, or account from the platform report.
- Pull conversions for one event. Do not mix leads with purchases. If the campaign optimized for
Purchase, the denominator is purchases — not add-to-carts, not landing-page views. - Divide spend by conversions. That is realized CPA.
- Optionally decompose it. Enter CPC + CVR, or CPM + CTR + CVR, to see which stage is inflating the number.
- Compare against your own ceiling first. Break-even CPA = AOV × gross margin. A $80 AOV at 40% margin breaks even at $32. Industry bands are a scale check, not a target.
Worked example 1: realized purchase CPA
- Total spend: $2,400
- Purchases: 60
- CPA = 2,400 ÷ 60 = $40
- AOV: $80
- Gross margin: 40%
- Break-even CPA = 80 × 0.40 = $32
- Implied ROAS = 80 ÷ 40 = 2.0×
$40 sits just above the Triple Whale ecommerce Meta median ($38.19) and above this store's $32 break-even — the campaign is "average" against a published band and still unprofitable on contribution. That is why the ceiling comes from your margin, not from a blog table.
Worked example 2: funnel CPA from CPM
- CPM: $12
- CTR: 1.5%
- CVR: 2%
- Implied CPC = 12 ÷ (10 × 1.5) = $0.80
- CPA = 0.80 ÷ 0.02 = $40 (same as 12 ÷ (0.015 × 0.02 × 1,000))
Raising CVR from 2% to 4% at the same CPC halves CPA to $20. Landing-page and offer work often beat a bid cut.
Cited CPA / CPL bands (do not mix events)
Google Ads search · cost per lead
- Typical range
- $26.84 – $131.63
- Published figure
- $66.69
- Statistic
- Average
Meta lead campaigns · cost per lead
- Typical range
- $3.16 – $76.71
- Published figure
- $27.66
- Statistic
- Average
Meta · ecommerce purchase CPA
- Typical range
- $29.99 – $49.48
- Published figure
- $38.19
- Statistic
- Median
Google Ads · ecommerce purchase CPA
- Typical range
- $25.15 – $35.37
- Published figure
- $23.74
- Statistic
- Median
| Segment | Typical range | Published figure | Statistic | Source |
|---|---|---|---|---|
| Google Ads search · cost per lead | $26.84 – $131.63 | $66.69 | Average | WordStream / LocaliQ, Search Advertising Benchmarks 2026 |
| Meta lead campaigns · cost per lead | $3.16 – $76.71 | $27.66 | Average | WordStream Facebook Ads Benchmarks 2025 (restated in the 2026 costs guide) |
| Meta · ecommerce purchase CPA | $29.99 – $49.48 | $38.19 | Median | Triple Whale 2025 ecommerce cohort (updated Feb 2026) |
| Google Ads · ecommerce purchase CPA | $25.15 – $35.37 | $23.74 | Median | Triple Whale 2025 ecommerce cohort (updated Feb 2026) |
The Google $66.69 figure is cost per lead across industries (legal at the high end; arts & entertainment at the published floor). The $23.74 figure is ecommerce purchase CPA. Averaging them produces a number that describes no real campaign.
CPA vs CAC vs ROAS
CPA
- Formula
- ad spend ÷ attributed conversions
- Owner
- Media buyer
- Use
- Daily campaign and creative optimization
CAC
- Formula
- fully loaded sales + marketing cost ÷ new customers
- Owner
- Finance / growth
- Use
- Unit economics, LTV:CAC, payback
ROAS
- Formula
- attributed revenue ÷ ad spend
- Owner
- Media buyer
- Use
- Inverse of CPA when AOV varies
| Metric | Formula | Owner | Use |
|---|---|---|---|
| CPA | ad spend ÷ attributed conversions | Media buyer | Daily campaign and creative optimization |
| CAC | fully loaded sales + marketing cost ÷ new customers | Finance / growth | Unit economics, LTV:CAC, payback |
| ROAS | attributed revenue ÷ ad spend | Media buyer | Inverse of CPA when AOV varies |
Fully loaded CAC is often 2–4× platform CPA because salaries, tools, agency fees, and production sit outside Ads Manager. See the CPA vs CAC comparison.
Common mistakes
- Mixing conversion events — a $28 Meta "CPA" on leads is not comparable to a $38 purchase CPA.
- Treating a published average or median as a target — break-even CPA is set by your margin; a $30 CPA can be great for a $90 bottle and fatal for a $25 candle.
- Using platform CPA as board-level CAC — add the rest of the cost stack before you report unit economics.
- Comparing CPA across platforms without CVR — a cheap TikTok CPC at 1% CVR can lose to a dearer Google CPC at 8% CVR. Compare at CPA, not at CPC.
- Cutting spend first when CPA rises — decompose into CPC × (1 / CVR). Creative fatigue and landing-page decay show up as CVR first.
Methodology & sources
Bands keep each publisher's conversion definition and year. WordStream / LocaliQ 2026 reports cross-industry search cost per lead at $66.69 (industry span $26.84–$131.63). WordStream's 2025 Facebook Ads Benchmarks — still the latest Meta lead-CPL cut, and the figure restated in the 2026 costs guide — reports lead-campaign CPL at $27.66 (industry span $3.16–$76.71). Triple Whale's 2025 ecommerce cohort (updated February 2026) reports purchase CPA at $38.19 on Meta ($29.99–$49.48 named-industry span) and $23.74 on Google. This page does not invent a blended "average CPA." Refresh when those publishers ship a new report year.
CPA Calculator (Cost Per Acquisition)
Free CPA calculator: realized cost per acquisition from spend and conversions, funnel CPA from CPC or CPM × CTR × CVR, break-even CPA from margin, target CAC from LTV, and target CPA from ROAS — with cited 2026 lead-CPL and ecommerce-purchase bands. CSV export. No sign-up.
Free Calculator
No sign up required. Use this calculator as much as you need.
Stop calculating by hand
Want AI to track this across every creative variant — and tie it back to ROAS automatically? That’s what AdSights does.
Request early accessRelated Calculators
ROAS Calculator
Calculate and analyze your return on ad spend (ROAS) to optimize campaign performance. Get data-driven insights on advertising efficiency, revenue attribution, and budget allocation to maximize marketing ROI.

CPM Calculator
Calculate Cost Per Mille (CPM) and analyze advertising campaign performance with precision. Get comprehensive insights on media buying efficiency, budget optimization, and campaign ROI analysis.

Incrementality Calculator
Measure the true impact of your marketing campaigns by calculating incrementality. Understand which portion of your conversions would have happened organically versus those directly caused by your marketing efforts.
Related Analyzers
Paid Social Benchmarks
Enter your CPM, CPC, or CTR and see how it compares to current published benchmarks for Meta, TikTok, LinkedIn, and YouTube — segmented by campaign objective where the source splits them. Free, no login, every figure cited with source and year.
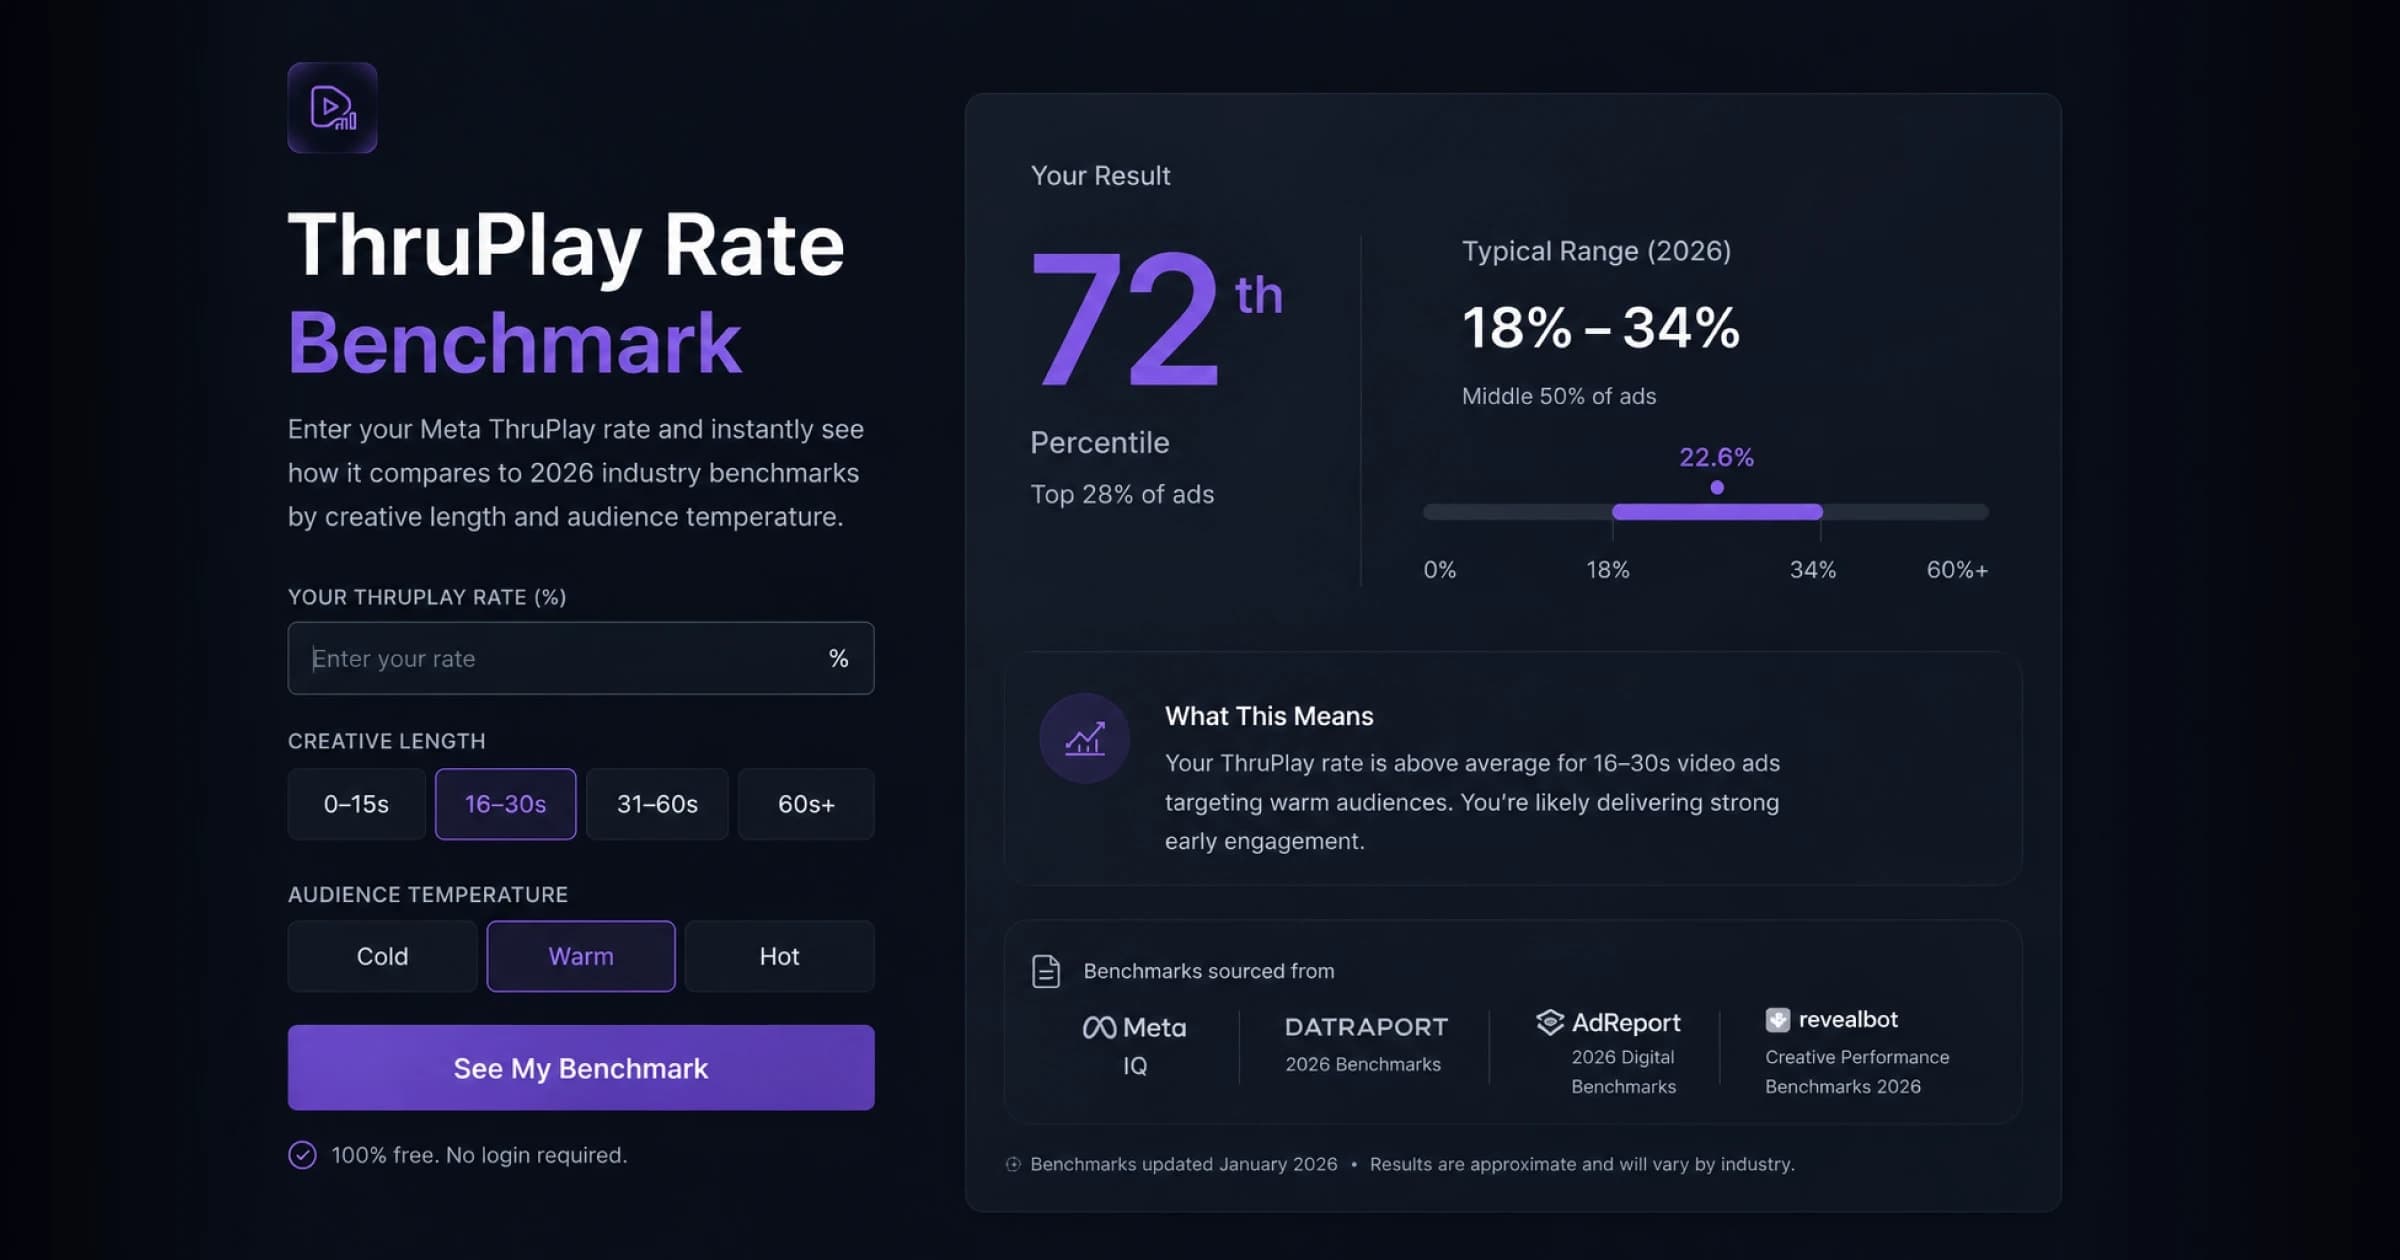
ThruPlay Rate Benchmark
Enter your Meta ThruPlay rate and instantly see how it compares to 2026 industry benchmarks by creative length and audience temperature. Free, no login — see where you land vs the cited typical range, with sources, and what your number means for creative performance.
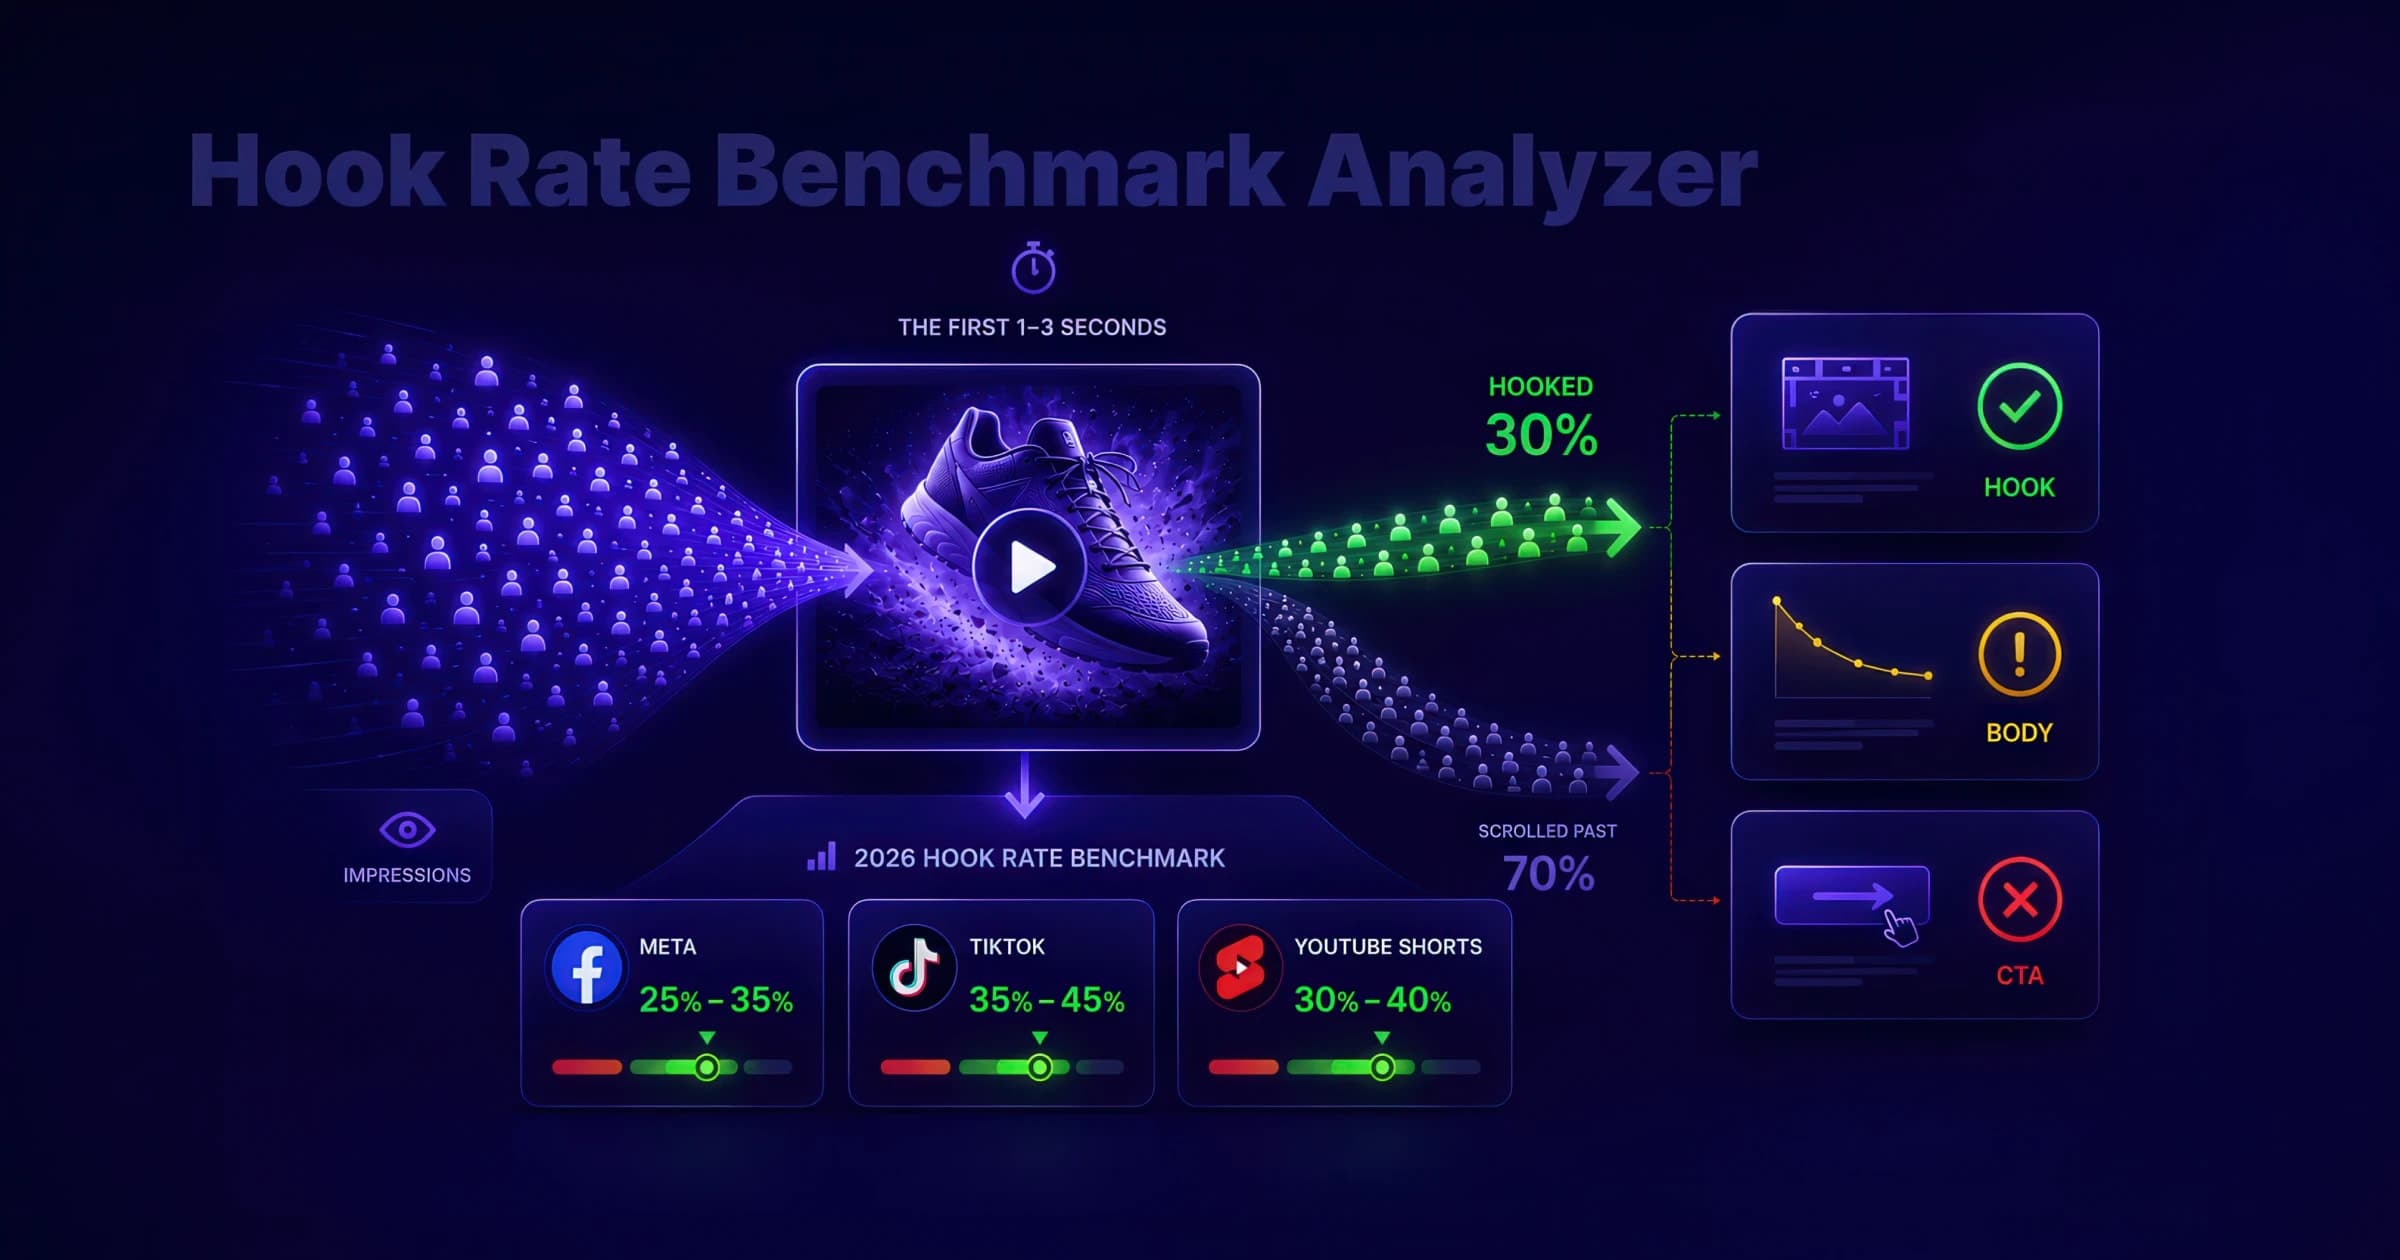
Hook Rate Benchmark
Calculate hook rate (thumbstop rate) for Meta, TikTok, and YouTube Shorts, compare it to 2026 benchmark ranges, and diagnose whether your video ad needs a stronger first frame, tighter body, or clearer CTA.
Related Terms
Cost Per Action
Cost Per Action (CPA) measures the average cost required to generate a specific user action or micro-conversion, such as form submissions, email signups, content downloads, or other engagement events. Unlike Cost Per Acquisition which focuses on customer acquisition, CPA tracks the cost efficiency of driving specific engagement milestones that may occur earlier in the customer journey.
Cost Per Acquisition
Cost Per Acquisition (CPA) measures the average cost required to acquire a customer or generate a complete conversion, such as a purchase, subscription signup, or other primary business objective. This metric focuses specifically on marketing and advertising costs associated with customer acquisition, making it distinct from the broader Customer Acquisition Cost (CAC) which includes all business costs.
Cost Per Mille
Cost Per Mille (CPM) represents the cost an advertiser pays to deliver 1,000 ad impressions to their target audience. This metric is fundamental for media planning and buying, enabling comparison of advertising costs across different platforms, formats, and audience segments. CPM pricing reflects placement quality, audience targeting precision, and market demand.
