Stay Updated
Get the latest insights on creative testing and ad optimization delivered to your inbox.
Get the latest insights on creative testing and ad optimization delivered to your inbox.

Continue reading about this topic with these recommended articles.
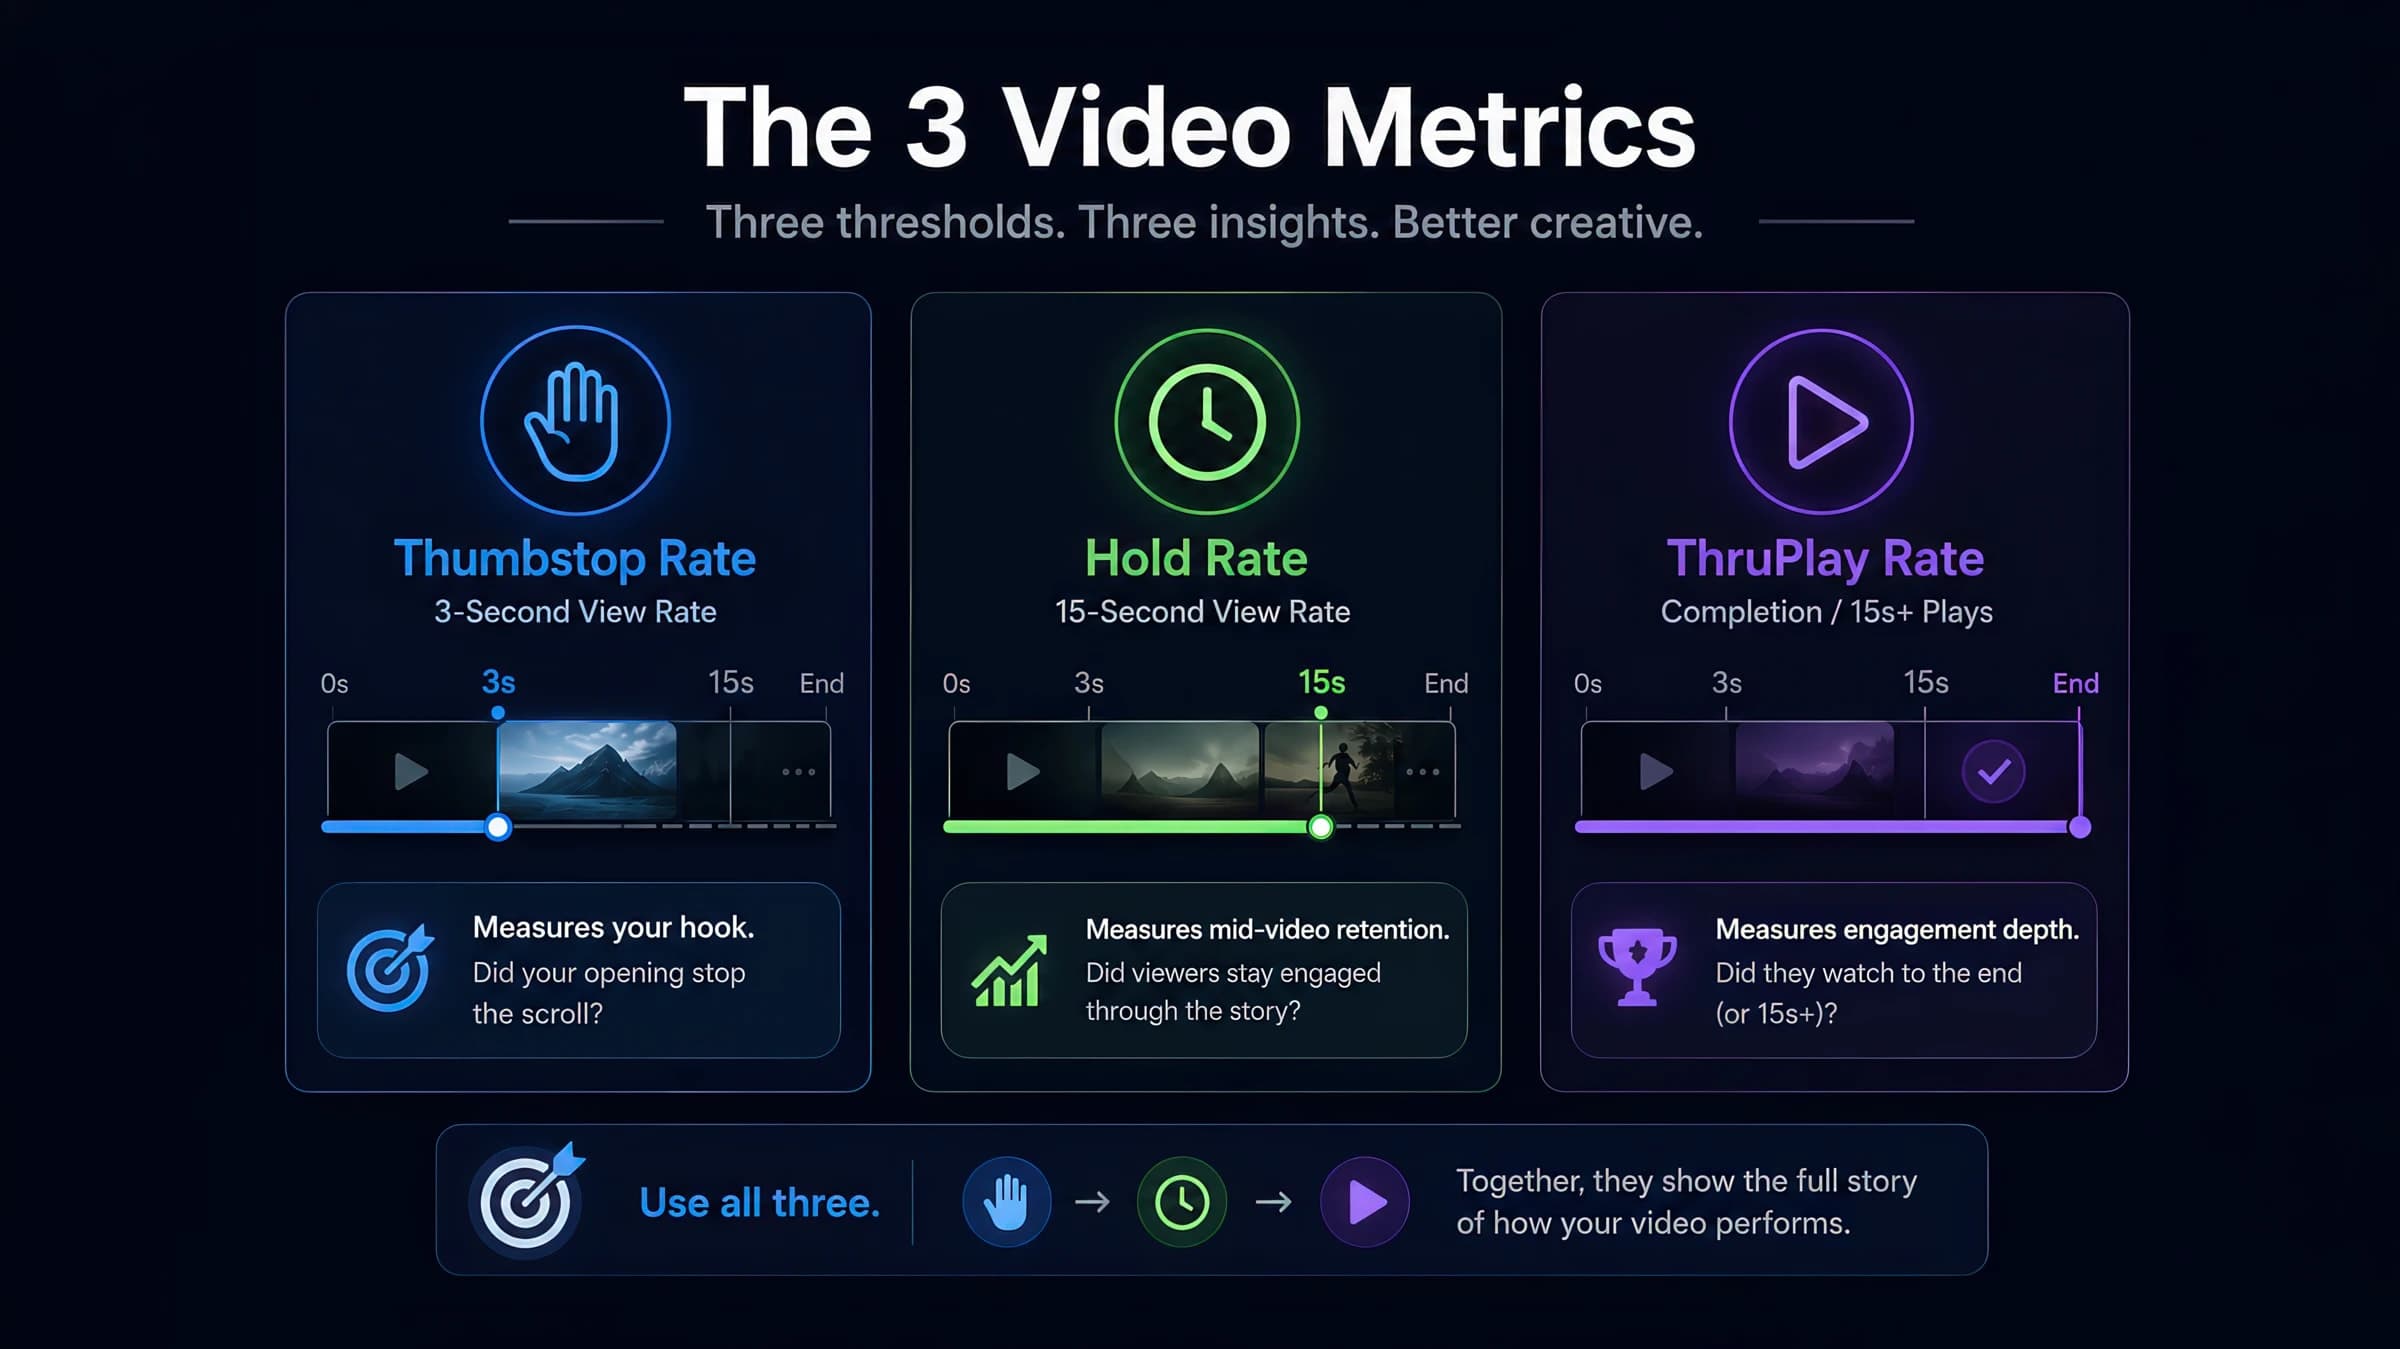
Meta Ads Manager hides the creative diagnostics that matter behind custom columns. This walkthrough shows exactly where to find thumbstop, hold, and ThruPlay — and how to read them without false conclusions.

AI-powered marketing tools
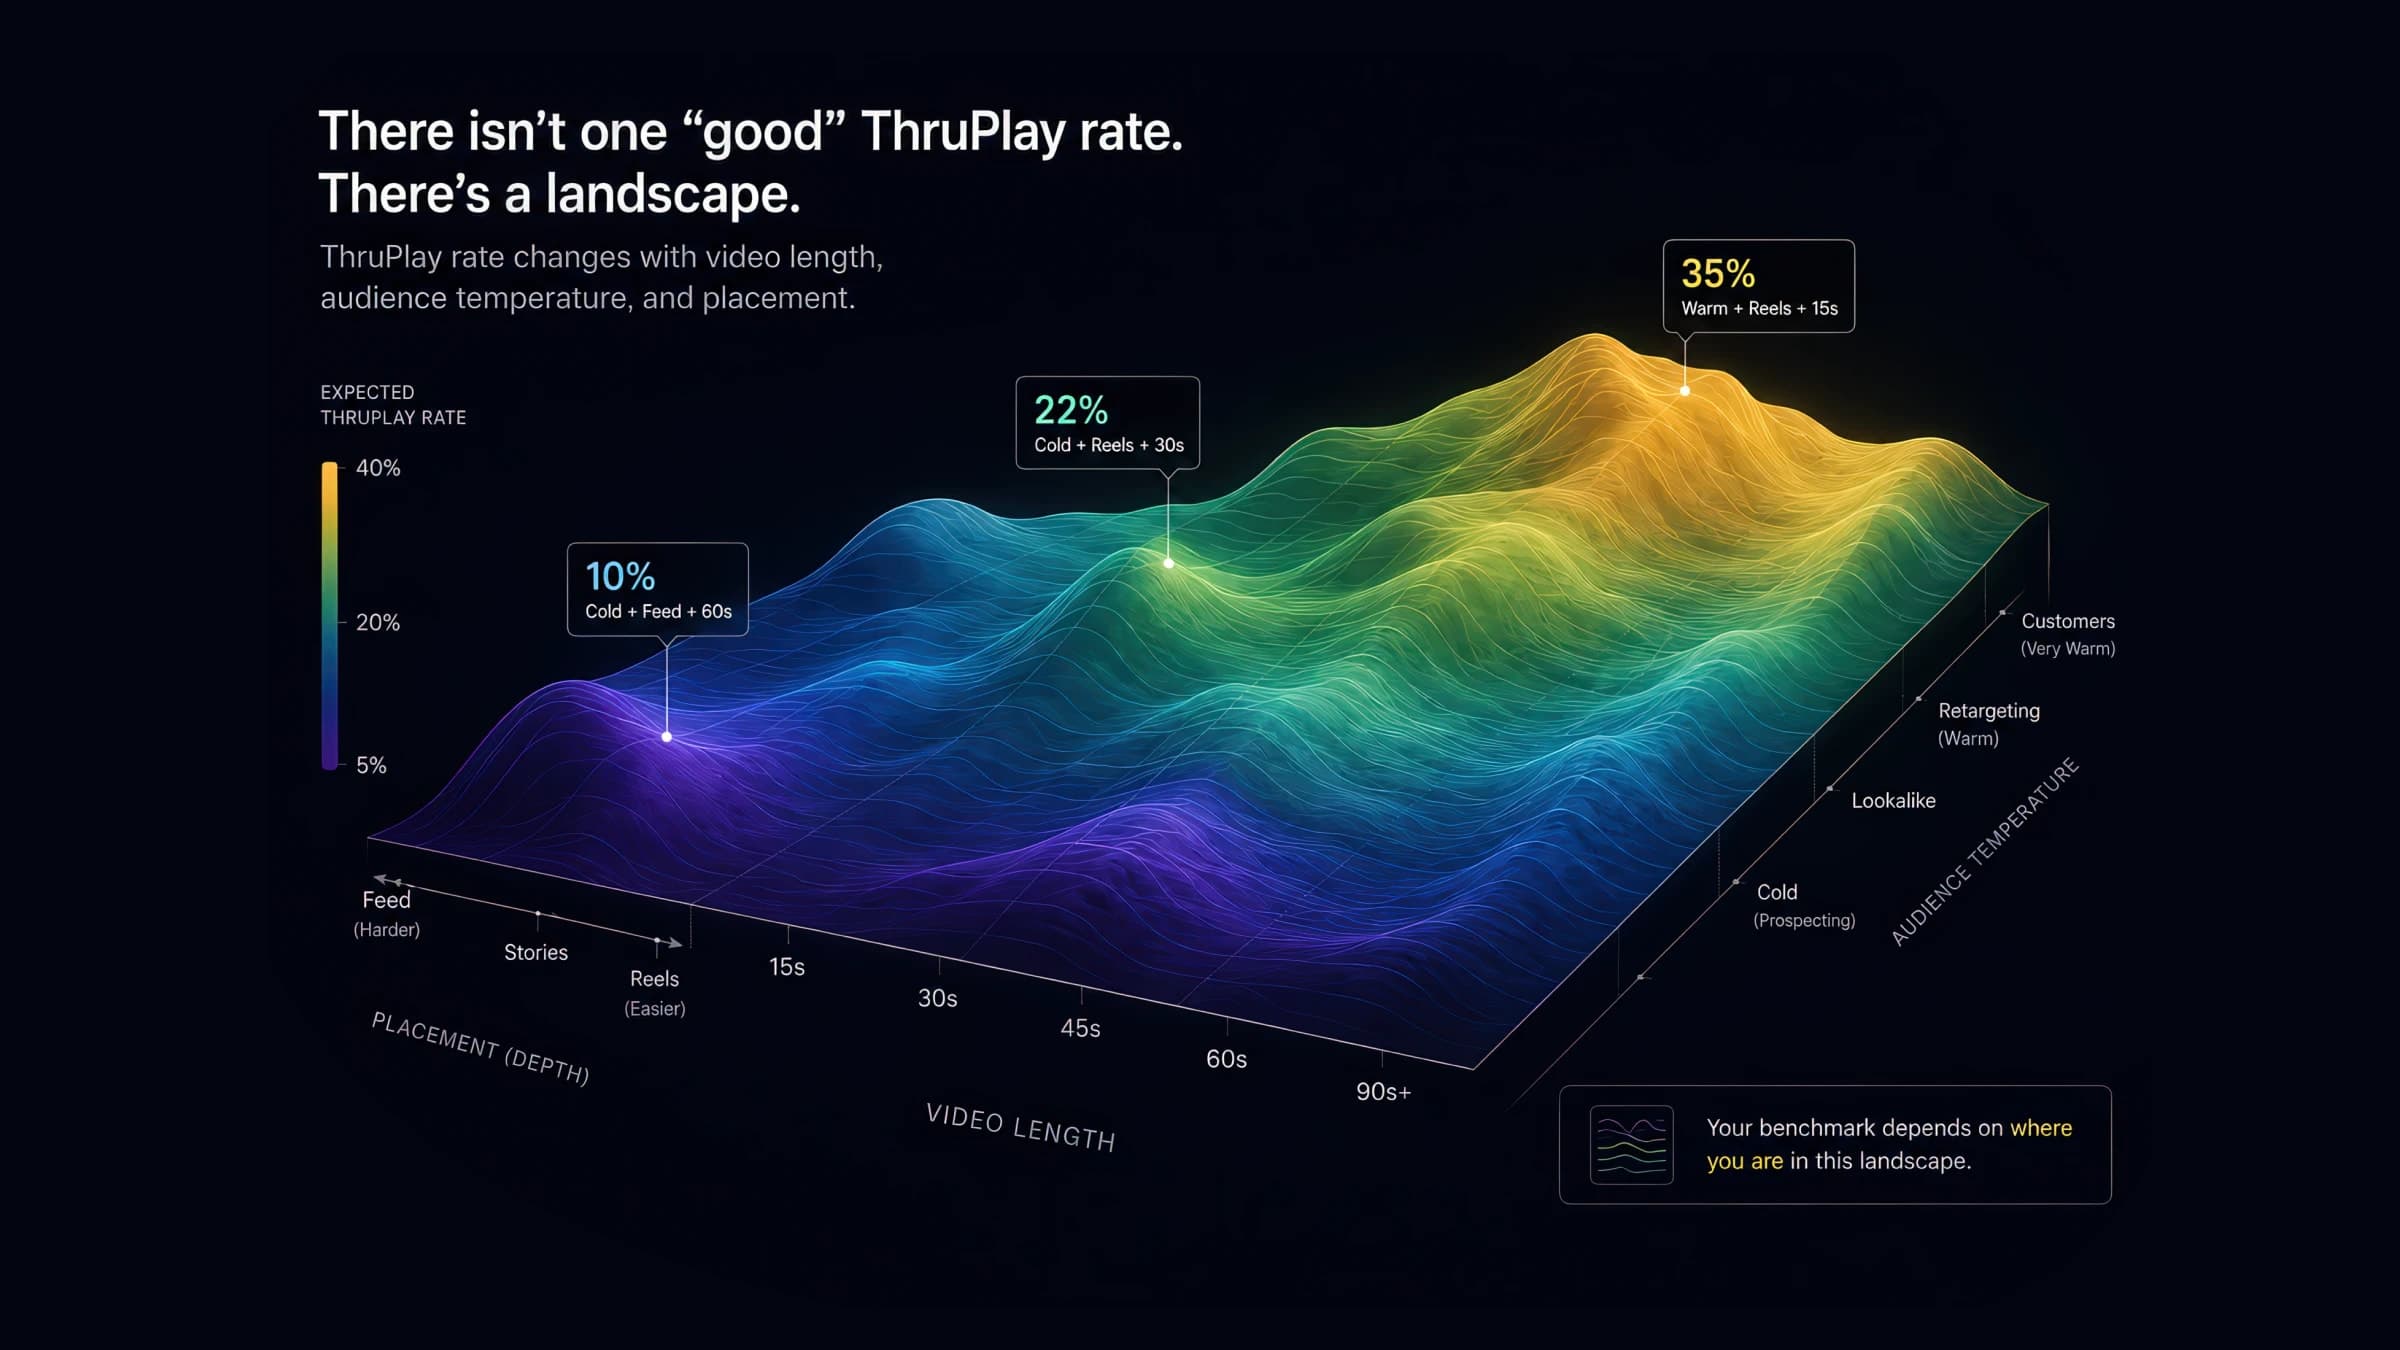
ThruPlay benchmarks shift 10–30 points by video length, placement, and audience temperature. See the full 2026 segmented data — and which number to actually cite.
AI-powered marketing tools

ThruPlay is a Meta-specific term, but the underlying mechanic — counting a view at a specific threshold — exists differently on TikTok, YouTube, and CTV. Here's how the metrics actually compare and where cross-platform benchmarks break down.
AI-powered marketing tools

Free CPA calculator: realized cost per acquisition from spend and conversions, funnel CPA from CPC or CPM × CTR × CVR, break-even CPA from margin, target CAC from LTV, and target CPA from ROAS — with cited 2026 lead-CPL and ecommerce-purchase bands. CSV export. No sign-up.
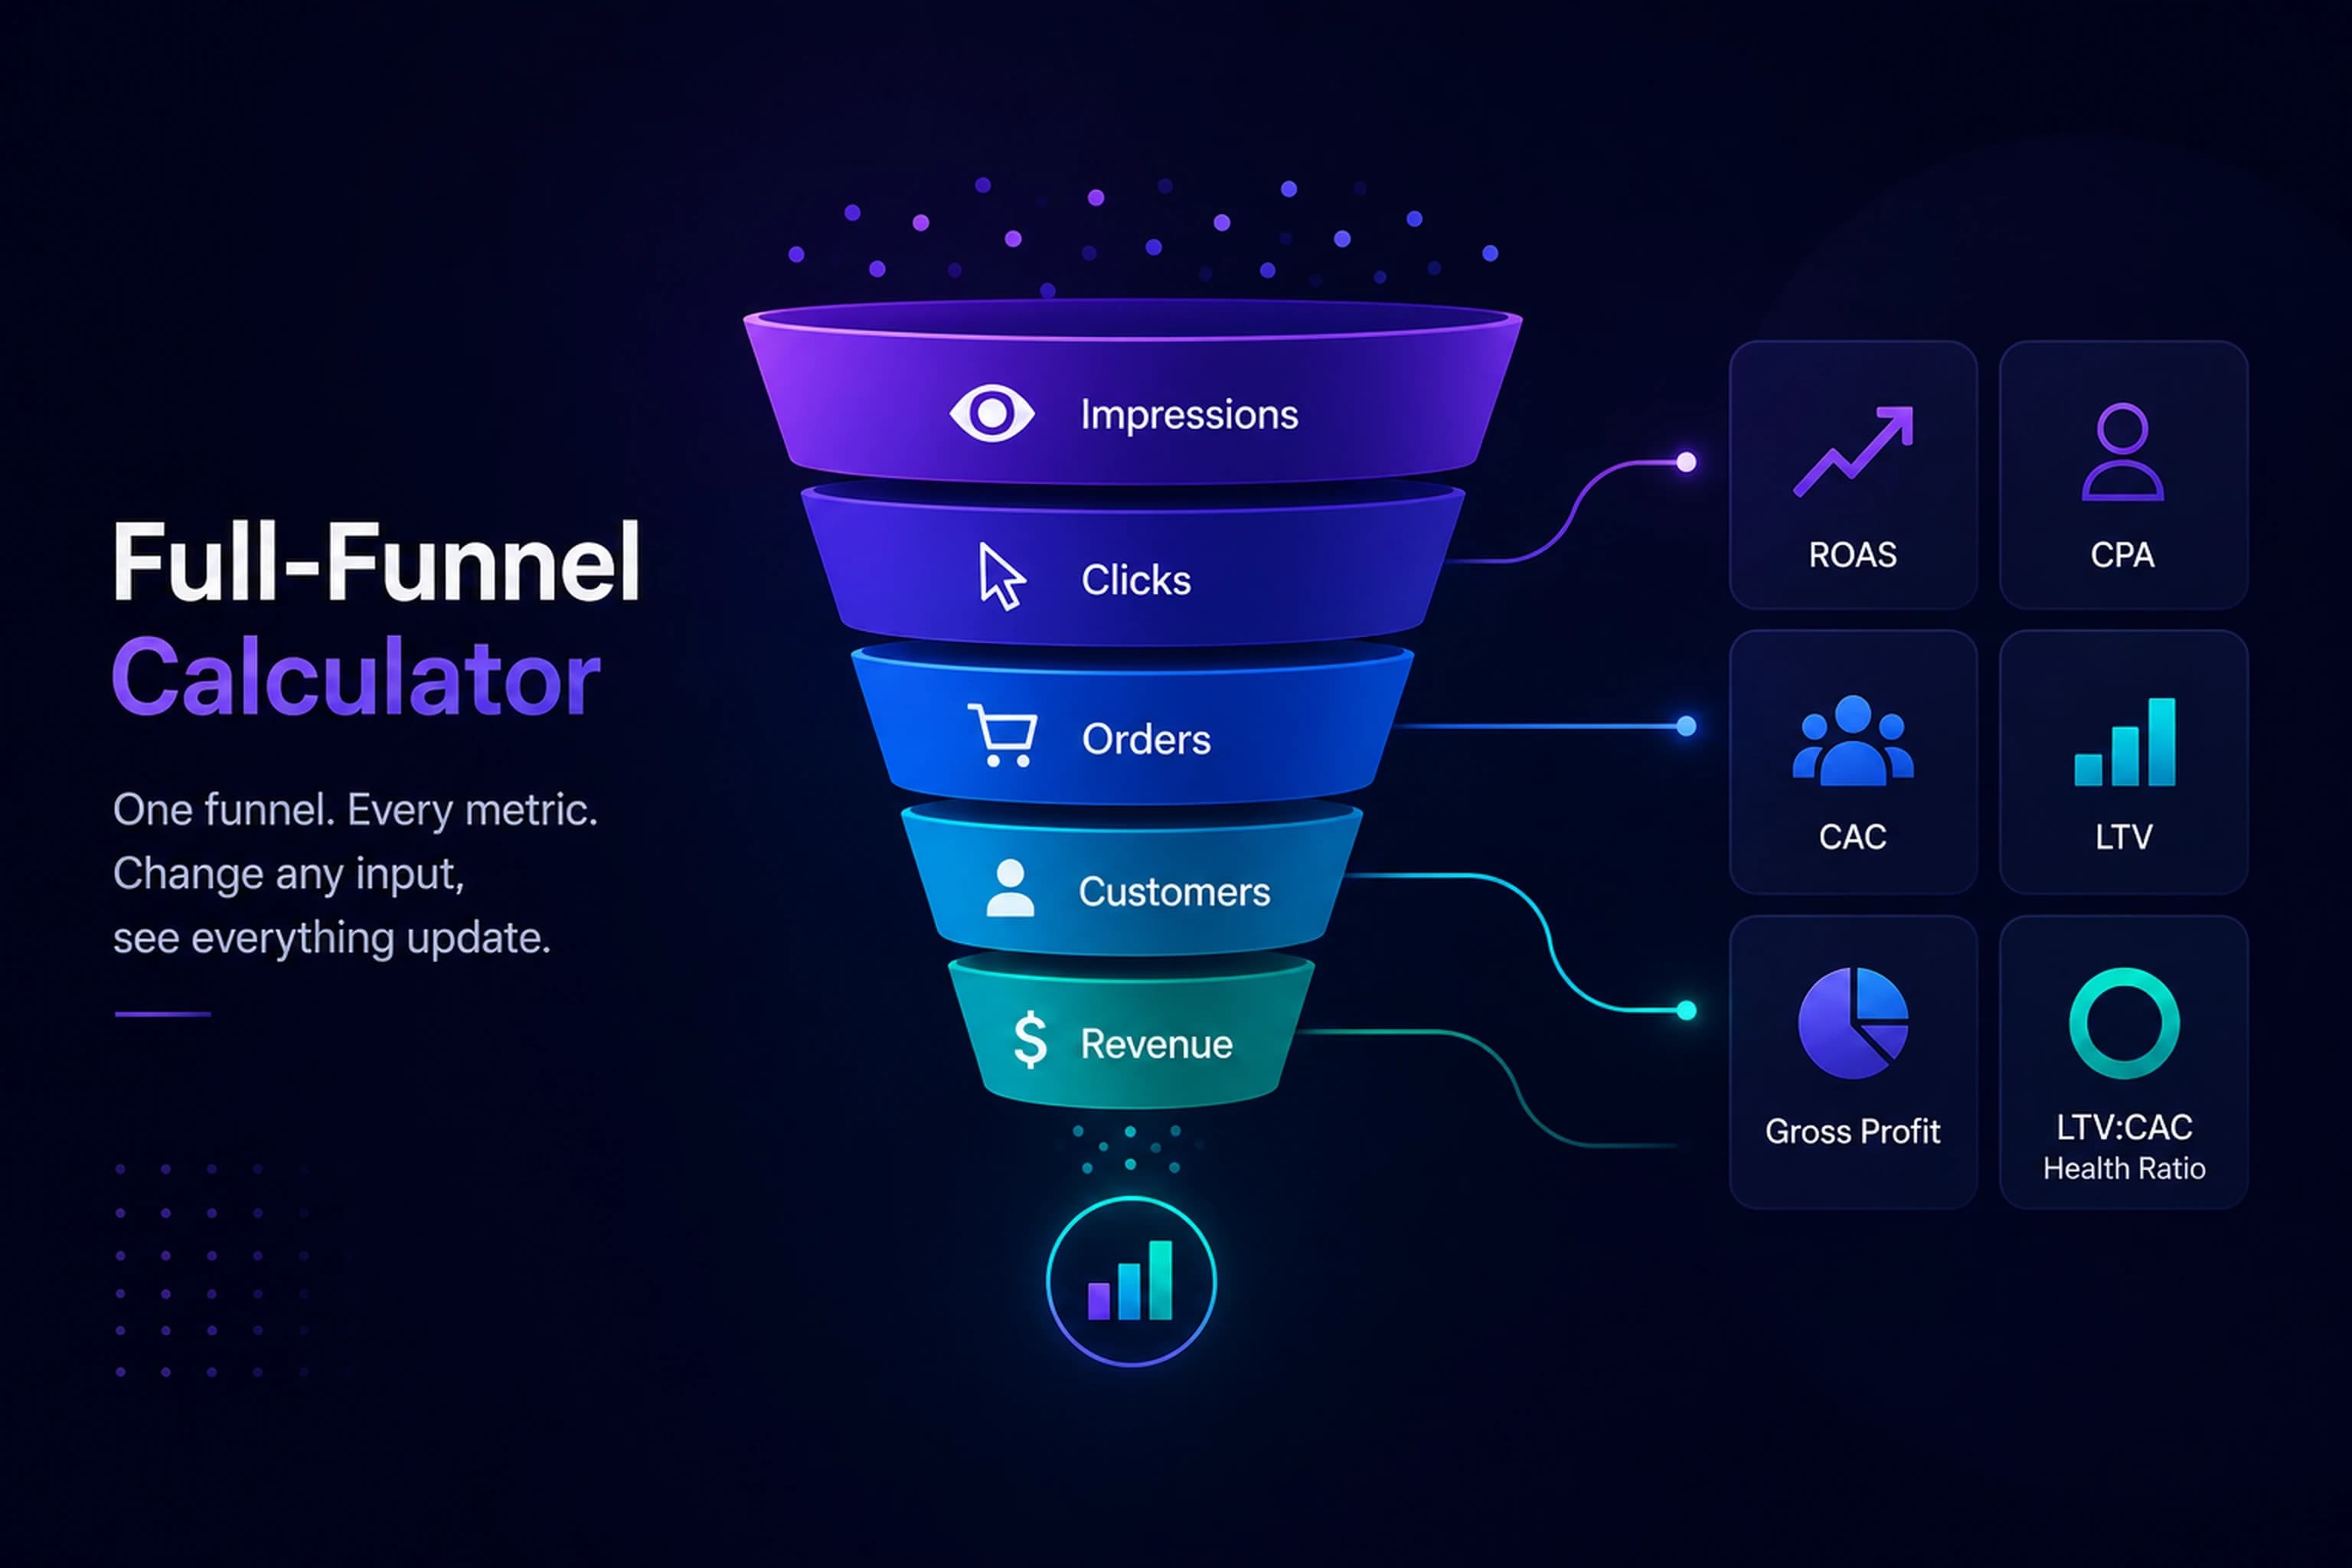
Model your entire paid-media funnel — impressions, CPM, CTR, CVR, and AOV — and instantly see ROAS, CPA, CAC, and LTV. Change any input to watch every downstream metric update, and gauge unit economics with an LTV:CAC health ratio.

Calculate Marketing Efficiency Ratio (MER) metrics to evaluate overall marketing performance, attributed efficiency, and new customer acquisition. Use our free MER calculator to apply multiple MER formulas (MER, aMER, nMER), analyze key efficiency metrics, and optimize your marketing ROI with data-driven insights.
Customer Acquisition Cost (CAC) is a comprehensive business metric that calculates the total investment required to convert a prospect into a paying customer. It includes marketing spend, sales costs, technology infrastructure, and operational overhead allocated to acquisition activities.
Return on Ad Spend (ROAS) is a marketing performance metric that measures the revenue generated per dollar of advertising spend. Unlike ROI which considers all business costs, ROAS specifically evaluates advertising efficiency by comparing directly attributable revenue to ad spend. This metric is crucial for optimizing campaign performance, budget allocation, and overall marketing strategy.
Average Order Value (AOV) is a critical e-commerce metric that measures the typical monetary value of each completed transaction by calculating the mean purchase amount across all orders in a given period. This metric is essential for evaluating sales performance, pricing strategies, and the effectiveness of upselling/cross-selling initiatives.
Cost Per Acquisition (CPA) measures the average cost required to acquire a customer or generate a complete conversion, such as a purchase, subscription signup, or other primary business objective. This metric focuses specifically on marketing and advertising costs associated with customer acquisition, making it distinct from the broader Customer Acquisition Cost (CAC) which includes all business costs.
A good CPA is below your break-even and inside the cited band for the same conversion event. 2026 Google and Meta lead-CPL vs ecommerce purchase CPA — and the calculator that runs the math.
Short answer: a good CPA is below your break-even (AOV × gross margin) and inside the cited band for the same conversion event. In 2026, WordStream / LocaliQ puts Google search cost per lead at $66.69 and Meta lead CPL at $27.66. Triple Whale’s 2025 ecommerce cohort — updated February 2026 — puts purchase CPA at $38.19 on Meta and $23.74 on Google. Those four numbers describe two different products. Averaging them produces a figure that describes no real campaign. Run your own number in the free CPA calculator.
"What's a good CPA?" gets answered with a single dollar figure at the wrong altitude — the same pathology we documented for ThruPlay rate. Three different things hide under the same acronym:
The CPA glossary owns the definition; the CPA vs CAC comparison owns the scope split. This post owns the 2026 bands and the break-even test that makes a band useful.
The definitional formula is:
CPA = Total Ad Spend ÷ Conversions
$1,000 spent for 25 purchases is a $40 CPA. The conversions in the denominator must be the event the spend was optimized for. Mixing Lead into a purchase campaign's CPA is how a $28 "win" appears next to a $40 problem.
Two identities are the same number from different inputs — they are what the CPA calculator funnel mode runs:
That second form is why a cheap CPC can still lose. A $0.90 TikTok CPC at 1% CVR is a $90 CPA. A $5.42 Google CPC at 8% CVR is a $67.75 CPA[3]. Compare platforms at CPA, not at CPC.
Industry medians answer "am I in the same zip code as peers?" They do not answer "can I afford this?"
Break-even CPA = AOV × gross margin.
| AOV | Gross margin | Break-even CPA | Implied ROAS at break-even | | --- | ---: | ---: | ---: | | $40 | 60% | $24 | 1.7× | | $80 | 40% | $32 | 2.5× | | $80 | 25% | $20 | 4.0× | | $150 | 50% | $75 | 2.0× |
A $30 Meta purchase CPA is a gift on the $150 / 50% row and a slow leak on the $80 / 25% row. That is why the calculator overlays break-even and optional LTV / ROAS ceilings on top of realized CPA instead of declaring a global grade.
Two other ceilings are useful when AOV is the wrong unit:
Honest, source-attributed figures. Low/high are the published industry-span extremes in that report — not a smoothed “typical” band. Triple Whale rows are ecommerce purchase CPA.
| Segment | Event | Typical range | Published figure | Statistic | Source | | --- | --- | --- | ---: | --- | --- | | Google Ads search | Cost per lead | $26.84 – $131.63 | $66.69 | Average | WordStream / LocaliQ Search Advertising Benchmarks 2026 | | Meta lead campaigns | Cost per lead | $3.16 – $76.71 | $27.66 | Average | WordStream Facebook Ads Benchmarks 2025 | | Meta ecommerce | Purchase | $29.99 – $49.48 | $38.19 | Median | Triple Whale 2025 cohort (updated Feb 2026) | | Google Ads ecommerce | Purchase | $25.15 – $35.37 | $23.74 | Median | Triple Whale 2025 cohort (updated Feb 2026) |
Two cautions before you screenshot the table into a Slack thread:
For CPM / CPC / CTR — the inputs that produce CPA — use the Paid Social Benchmarks analyzer rather than this table. That tool stays at platform × objective grain so it does not duplicate the glossary's per-industry cost tables.
When CPA inflates, the useful identity is CPA = CPC × (1 / CVR). Three usual causes, in the order we see them:
Do not cut spend first. Decompose, then decide. The calculator's funnel mode and CVR-sensitivity chart exist for that exact conversation: holding CPC constant, doubling CVR halves CPA.
Purchase, Lead, Trial start).The glossary still owns "what CPA means." The comparison still owns "CPA vs CAC." This post and the calculator own the 2026 bands, the funnel identities, and the break-even test that turns a published median into a decision.
WordStream / LocaliQ 2026
Cross-industry average
$66.69
Lead event. Arts & Entertainment is the published floor; Attorneys & Legal Services the ceiling.
WordStream / LocaliQ 2026
Facebook lead campaigns
$27.66
Lead-form campaigns. Do not compare to purchase CPA.
Triple Whale 2025 cohort (2026 recaps)
Ecommerce median
$38.19
Purchase event across ~35k ecommerce brands. Lifestyle cheaper; electronics dearer.
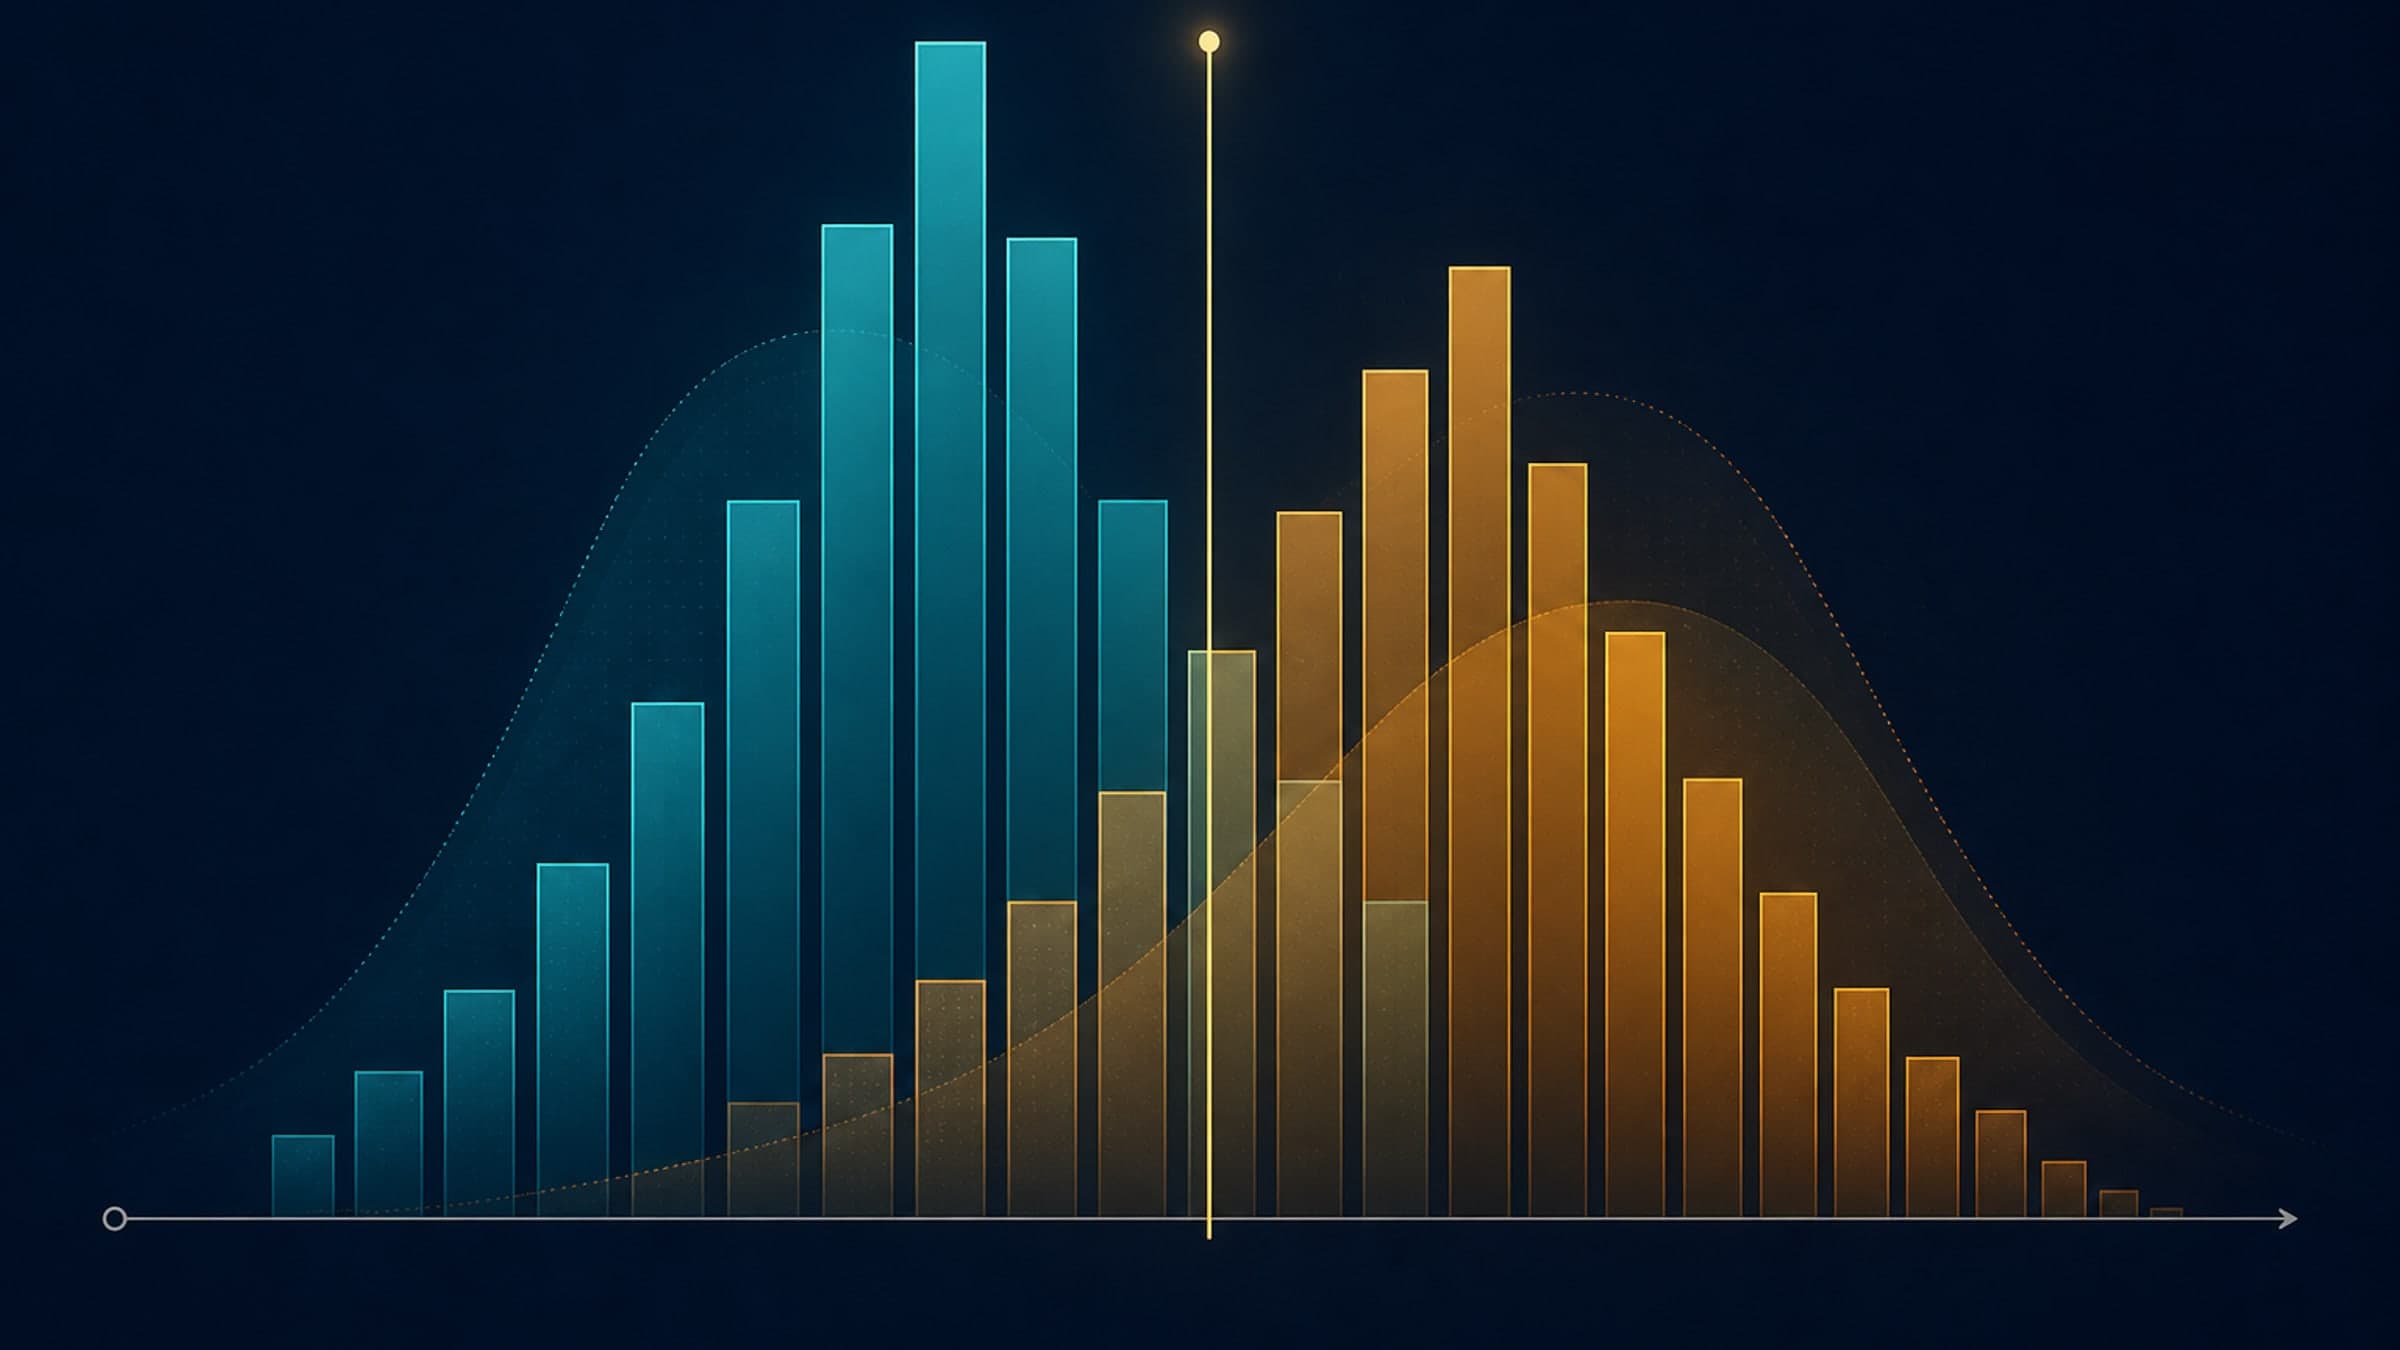
Truncating the Y-axis on CPA ($48–$52) exaggerates a modest shift. Zero-based axes preserve honest proportions.
| Campaign | CPA (USD) |
|---|---|
| Campaign A | $48 |
| Campaign B | $50 |
| Campaign C | $52 |

