Stay Updated
Get the latest insights on creative testing and ad optimization delivered to your inbox.
Get the latest insights on creative testing and ad optimization delivered to your inbox.
Continue reading about this topic with these recommended articles.
Platform ROAS overstates true impact by 20–85% depending on channel. This guide covers Meta Conversion Lift, geo holdouts, iROAS math, and the decision framework that turns lift results into budget moves.
AI-powered marketing tools

Learn how to transform raw advertising metrics into actionable creative insights through data storytelling and interpretation. Master the art of deriving meaningful narratives from campaign data.
AI-powered marketing tools

Meta only flags creative fatigue after cost per result doubles. Catch it 1–2 weeks earlier with frequency, CTR, and CPM thresholds — plus a worked example, detection checklist, and refresh-cadence framework.
AI-powered marketing tools

Calculate Marketing Efficiency Ratio (MER) metrics to evaluate overall marketing performance, attributed efficiency, and new customer acquisition. Use our free MER calculator to apply multiple MER formulas (MER, aMER, nMER), analyze key efficiency metrics, and optimize your marketing ROI with data-driven insights.

Measure the true impact of your marketing campaigns by calculating incrementality. Understand which portion of your conversions would have happened organically versus those directly caused by your marketing efforts.

Calculate and analyze your return on ad spend (ROAS) to optimize campaign performance. Get data-driven insights on advertising efficiency, revenue attribution, and budget allocation to maximize marketing ROI.
Marketing Efficiency Ratio measures the overall effectiveness of marketing spend by comparing total revenue to total marketing costs. It provides a holistic view of marketing performance across all channels and customer types, including both direct and indirect revenue attribution. Also known as 'blended MER' since it considers all revenue rather than just attributed revenue.
Return on Ad Spend (ROAS) is a marketing performance metric that measures the revenue generated per dollar of advertising spend. Unlike ROI which considers all business costs, ROAS specifically evaluates advertising efficiency by comparing directly attributable revenue to ad spend. This metric is crucial for optimizing campaign performance, budget allocation, and overall marketing strategy.
New Marketing Efficiency Ratio (nMER) measures acquisition efficiency by dividing revenue from first-time customers by total marketing spend. Popularized by Triple Whale and the modern DTC measurement stack, it answers the question blended MER cannot: how efficiently is the marketing program buying new customers once repeat and subscription revenue are stripped out of the numerator. Unlike ROAS, which counts only the revenue an attribution model credits to a single channel against that channel's ad spend, nMER is attribution-agnostic — all first-order revenue over all marketing cost. And where nCAC prices each new customer in dollars, nMER expresses the same acquisition economics as a revenue multiple. For paid-social advertisers it is the natural guardrail for prospecting budgets: a healthy retention engine can hold blended MER steady for months while cold-audience acquisition quietly becomes unprofitable, and nMER is the number that exposes that decay early.
Incrementality is a scientific measurement approach that determines the true incremental value generated by a marketing activity by comparing outcomes against a statistically valid control group. Unlike basic attribution models, incrementality testing uses randomized controlled trials and sophisticated causal inference techniques to identify what would have happened without the marketing intervention, enabling marketers to understand the real marginal impact of their spending and optimize toward truly incremental growth.
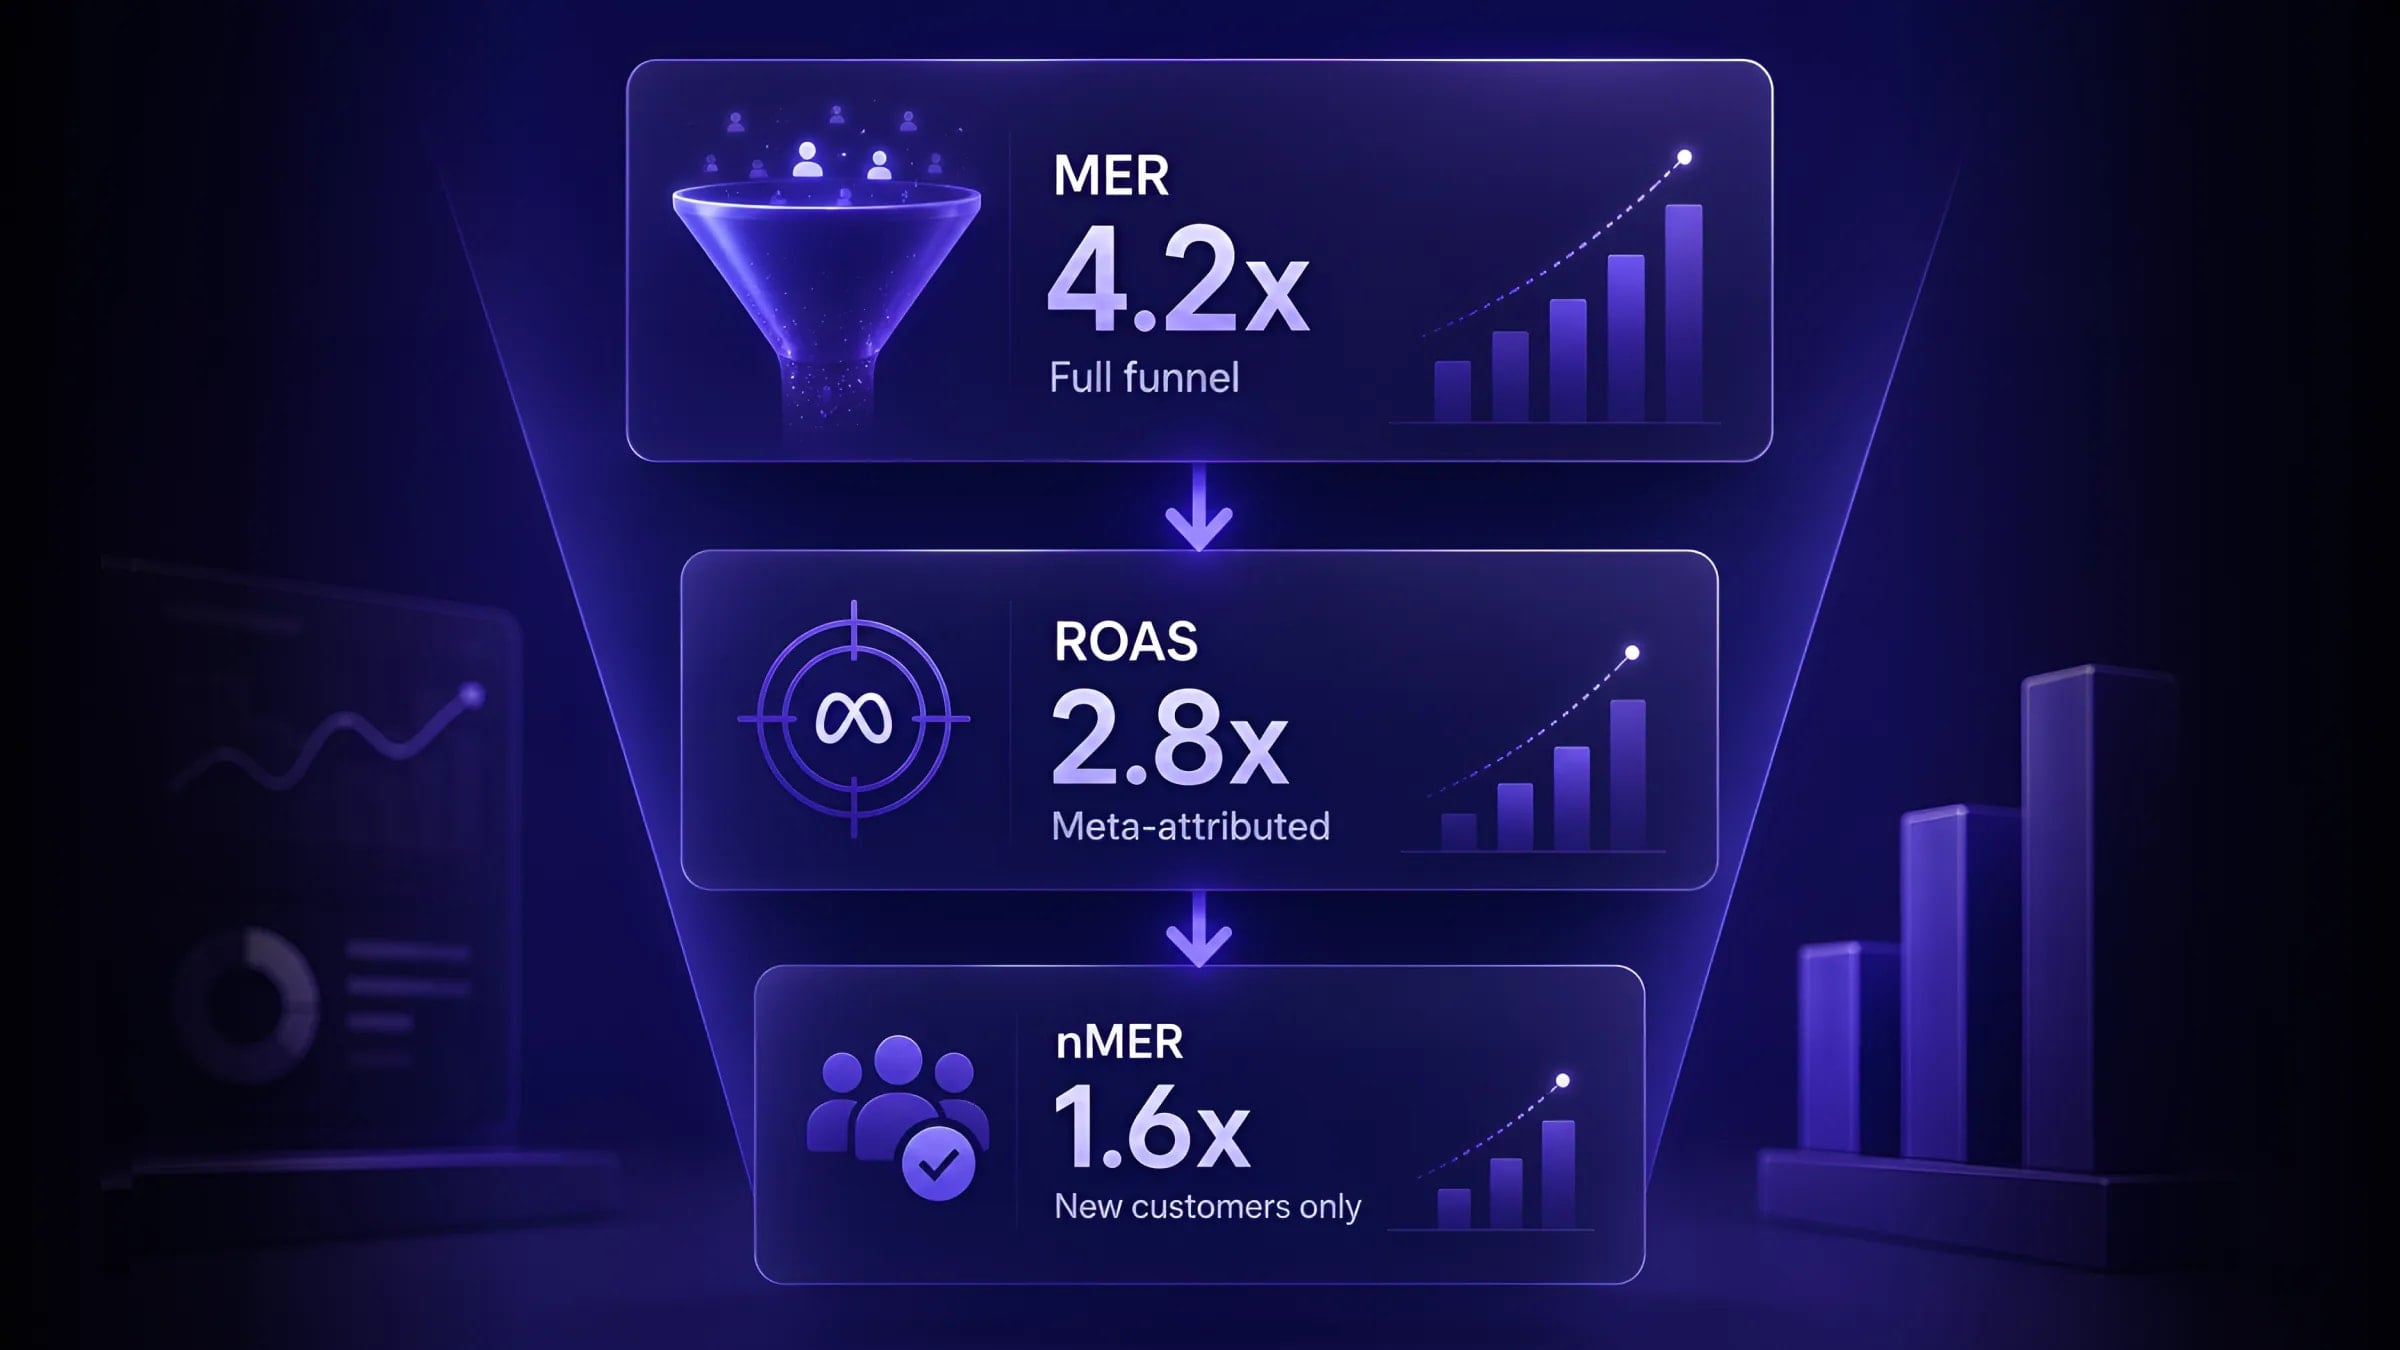
Platform ROAS, blended MER, and new-customer nMER answer different questions — and using the wrong one in the wrong meeting misallocates budget. See the three-layer stack and when to report each.
Short answer: report ROAS inside ad accounts for tactical optimization, MER to finance and leadership for blended efficiency, and nMER when the question is specifically acquisition health. They are not competing metrics — they are different altitudes on the same business. Use the wrong one in the wrong meeting and you will either scale a platform number that overstates incrementality or cut prospecting that feeds future MER.
If you have sat in a weekly performance review where Meta reports 3.8x ROAS, Triple Whale shows 4.1x MER, and the CFO asks "are we efficient?" — you have already felt the confusion. Each number is correct within its scope and misleading outside it. Platform ROAS is often 1.5–3x higher than true incremental return because attribution models credit conversions that would have happened anyway. MER measures efficiency but not causality — a 4.5x MER does not prove every ad dollar is incremental. nMER strips repeat revenue to expose whether acquisition itself is paying for its seat at the table.
This is the first article in our Media Buying topic hub. It extends the MER vs ROAS comparison with the nMER layer and a practical reporting stack — the narrative wrapper around definitions our glossary already covers.
The confusion is not mathematical — all three are ratios. The confusion is scope: what sits in the numerator and denominator, and therefore what question each ratio can honestly answer.
Search Engine Journal's framing captures the stack cleanly: attribution describes the journey, incrementality measures sensitivity, and MER is the metric the business runs on. This post adds where ROAS and nMER sit relative to MER so you know which to pull for which meeting.
is the media buyer's daily instrument. It is fast, granular, and actionable inside Ads Manager — which is exactly why it is dangerous outside Ads Manager.
Platform ROAS shifts when attribution windows change, when Meta updates its model, or when Google rolls out new conversion logic. MER does not move when platforms change reporting rules — it is anchored to your Shopify or warehouse revenue, not ad-manager credit. That stability is why finance prefers MER; that granularity is why media buyers need ROAS.
Calculate platform ROAS instantly with our . For the side-by-side definitional comparison, see MER vs ROAS.
— sometimes called blended ROAS — is total revenue divided by total marketing spend:
"Total marketing spend" is where teams diverge — and you must align internally before comparing MER across companies or even across quarters. Common inclusions: paid media, email/SMS tools, influencer fees, affiliate payouts, agency retainers. Some teams include creative production; others do not. Pick a definition and hold it.
MER is the number founders and CFOs actually ask about — "for every dollar we spent on marketing, how many dollars came back?" — because it treats marketing as one investment producing one revenue stream. It includes organic and direct revenue on top, and non-ad marketing costs on the bottom.
Plug your numbers into the (which also computes aMER and nMER).
narrows the numerator to first-time customer revenue only:
nMER is typically lower than blended MER because it excludes the repeat purchase, email, and subscription revenue that mature brands depend on. A subscription business might show 1.2x nMER alongside 4.0x MER — and that gap is healthy if LTV pays back on order two or three.
Pair nMER with — nMER is the revenue-efficiency view; nCAC is the cost-efficiency view of the same acquisition question.
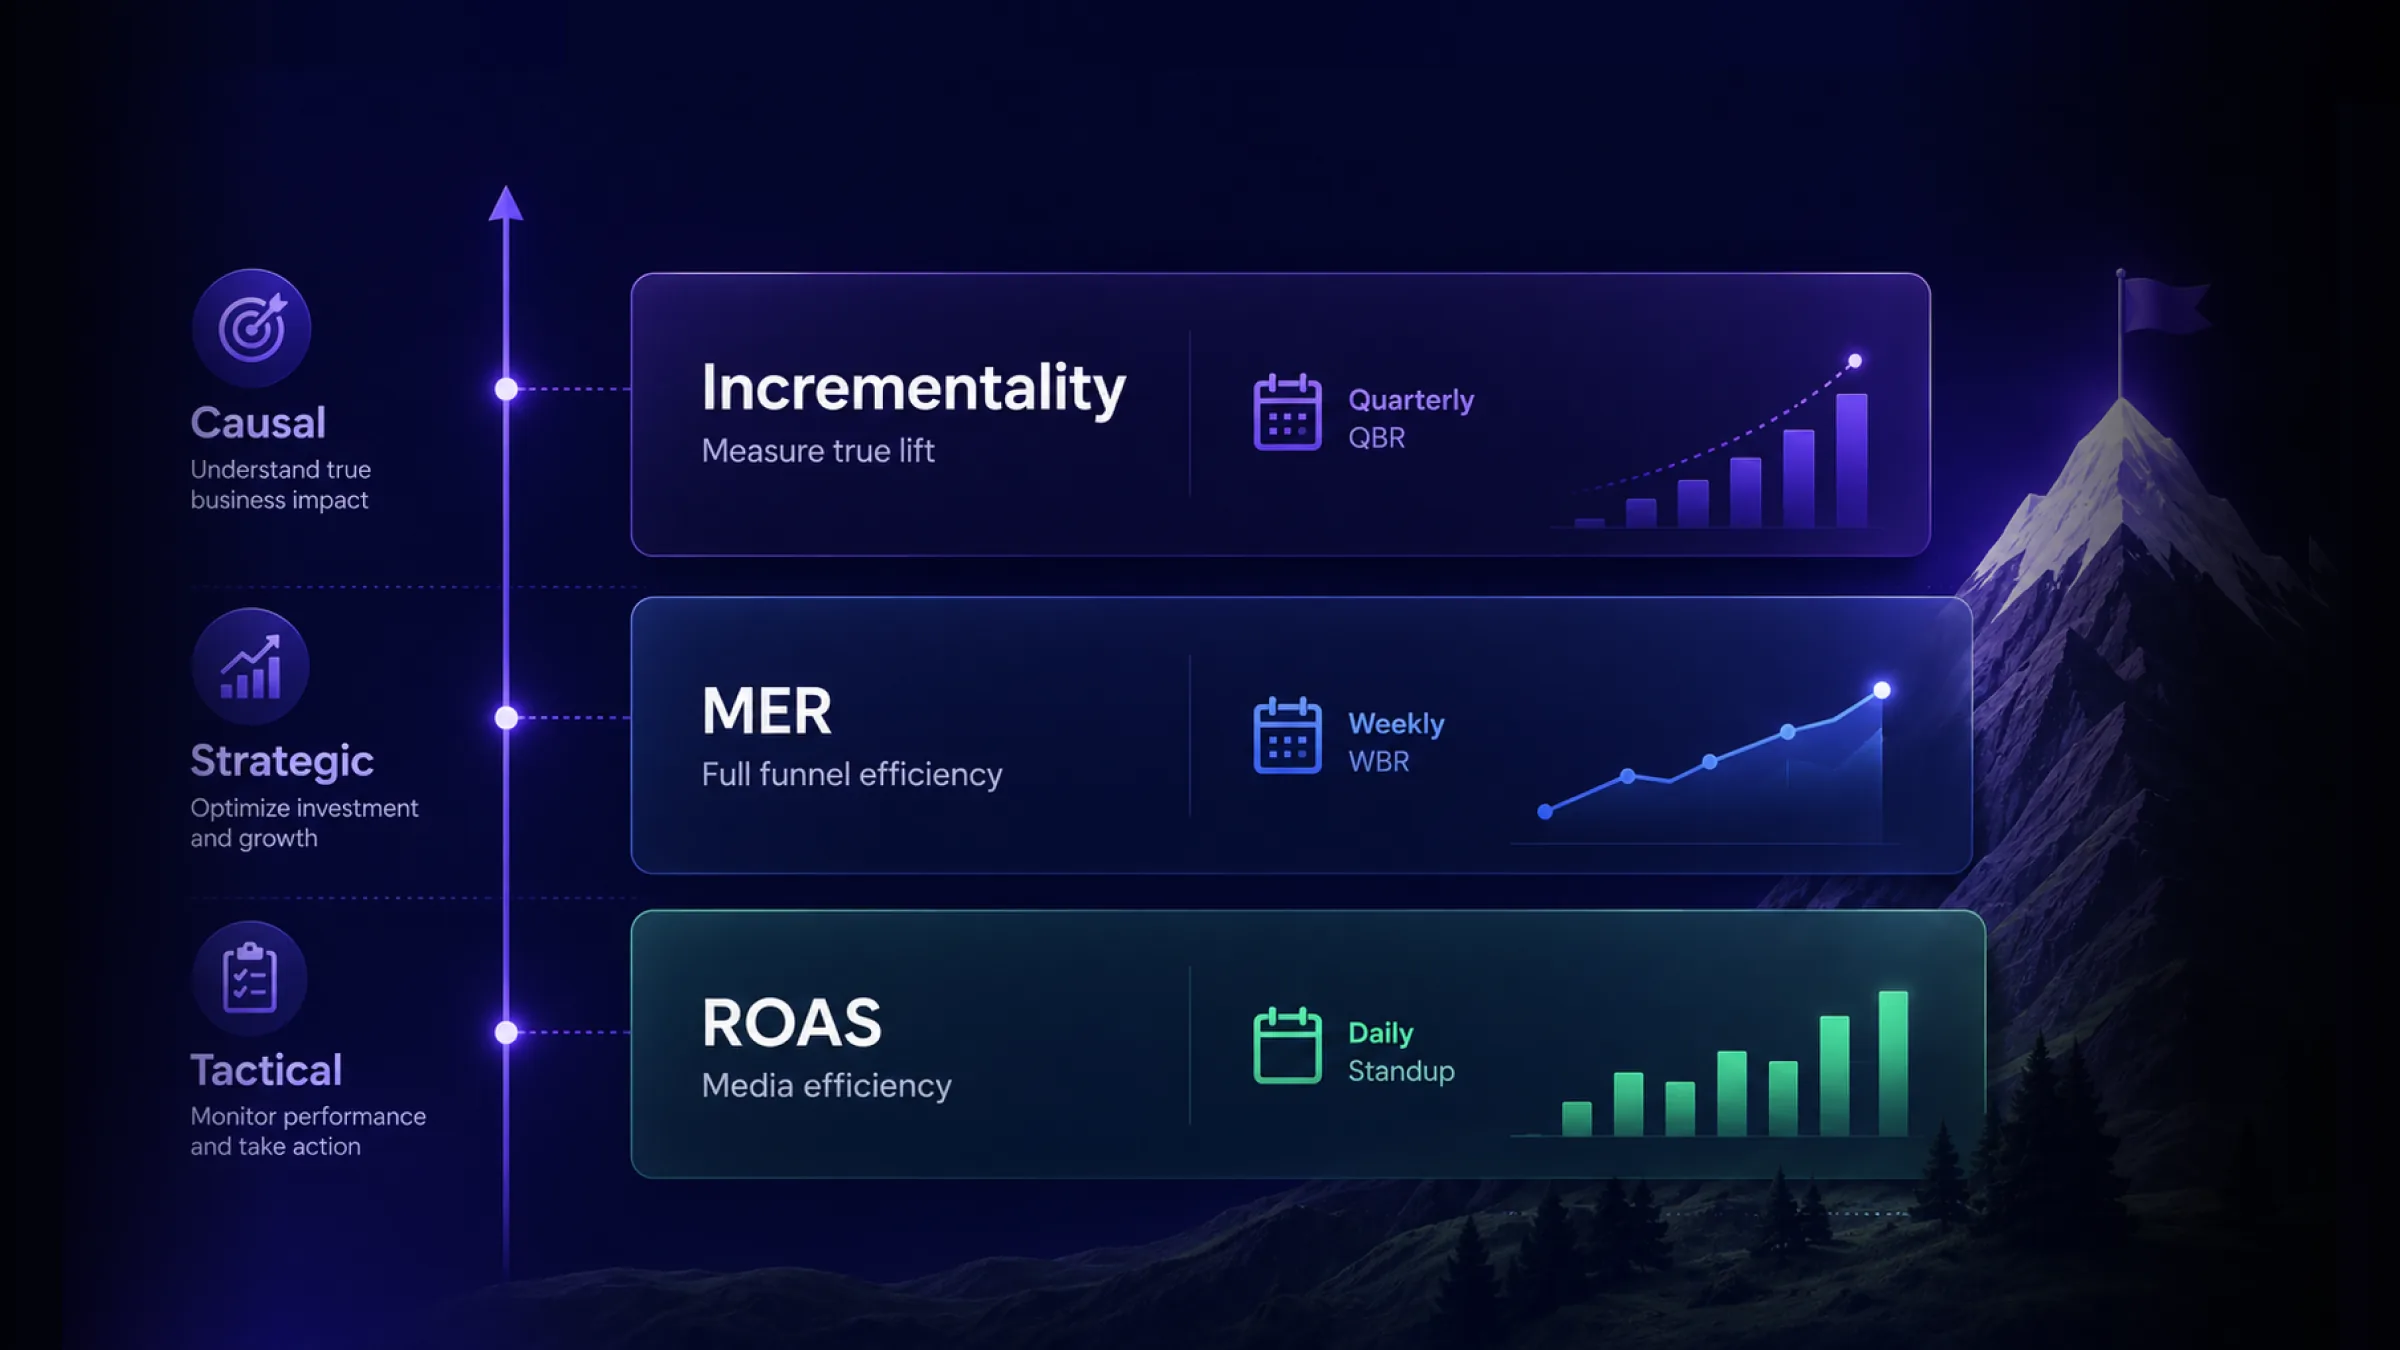
Do not pick one metric. Stack them — each at the cadence and altitude where it is honest.
Pixeltree's three-lens framing is the operational version: platform data for tactical decisions inside campaigns, MER for weekly budget decisions, incrementality tests for the quarterly truth check. No single number runs the business.
The real value of stacking metrics is diagnosis — when two numbers tell opposite stories, something specific is broken.
These scenarios mirror the examples in our MER vs ROAS comparison — this post adds the nMER diagnostic layer and the reporting-cadence stack around them.
For your next weekly business review, try this structure:
The argument about whether attribution is broken was the wrong argument. Attribution describes the journey. Incrementality measures sensitivity. MER is the metric the business runs on — and nMER tells you whether acquisition is carrying its share. Stack all three, report each at the right altitude, and the Monday meeting stops being a debate about which platform number to trust.
Scope: one platform, ad spend only, platform-attributed revenue. Tactical. Changes when Meta updates attribution windows.
Scope: all channels, all marketing spend, all revenue. Strategic. Indifferent to which platform gets credit.
Scope: all marketing spend, new-customer revenue only. Acquisition-focused. Strips repeat and subscription lift.
MER = Total Revenue ÷ Total Marketing Spend
Typical MER median ($0–$200K/mo)
Typical MER median ($200K–$2M/mo)
Typical MER median ($2M+/mo)
MER tells you whether the investment is efficient. It does not tell you whether paid media caused that efficiency. A brand running 4.5x MER with 70% organic/direct revenue could pause all ads and barely move the number — that is an incrementality question, not a MER question.
nMER = New Customer Revenue ÷ Total Marketing Spend
Acquisition is the bottleneck
nMER exposes whether cold-audience spend earns its keep.
Repeat is the engine
Low nMER with high MER and strong LTV is a feature, not a bug.
Which metric to report, to whom, and how often
Daily · Media buyers
Weekly · Leadership
Quarterly · Strategy
Primary: Platform ROAS, CPA, creative-level metrics. Secondary: MER trend (context for whether scaling is safe). Rarely: nMER unless running a prospecting-heavy account where acquisition is the entire game.
Primary: MER trend, nMER trend, channel mix. Secondary: Platform ROAS by channel (directional, not gospel). Quarterly: Incrementality read to validate whether MER movement is causal.
Primary: MER (and nMER if acquisition-heavy). Never lead with: Platform ROAS — it will mislead on blended profitability. Annually: Incrementality summary to justify total marketing budget size.
Expand each scenario for the diagnostic read
Meta reports 4.0x ROAS but MER is 2.2x. Paid is efficient in-platform, but total revenue is not keeping pace with all marketing spend. Likely causes: attributed ROAS overstates incrementality; email/SMS or influencer spend is underperforming; or repeat revenue is eroding. Action: Run a geo-holdout on Meta; audit non-ad marketing spend; check retention cohorts.
Prospecting ROAS is 1.3x (looks bad in Ads Manager) but MER is 4.5x. Repeat purchase, email, and organic direct carry the business. Cutting prospecting based on ROAS alone shrinks the new-customer pipeline that feeds future MER. Action: Check nMER before cutting; model LTV payback on first order.
MER is 4.0x but nMER is 1.4x. The business is efficient on repeat but acquisition is expensive. Sustainable only if LTV supports it. Action: Audit prospecting creative efficiency; compare nCAC to LTV; do not celebrate MER if new customer count is flat.
ROAS, MER, and nMER all trend down together. This is not an attribution artifact — the whole system is losing efficiency. Action: Check creative fatigue, offer competitiveness, and market saturation before blaming attribution.
Blended efficiency trend week-over-week
Is the whole marketing program healthy? Compare to your target band (e.g., 3.5x–5.0x for scaling DTC). Flag if MER moved more than 10% without a known cause (promo, seasonality, spend shift).
New-customer efficiency trend
Is prospecting earning enough first-order revenue? If nMER is below your payback threshold and new customer count is flat, the problem is acquisition creative or offer — not attribution.
Tactical read for media buyers
Which platforms are efficient *within their attribution scope*? Use for budget allocation direction — scale the channel trending up, investigate the channel trending down. Do not treat platform ROAS as MER.
Quarterly truth check
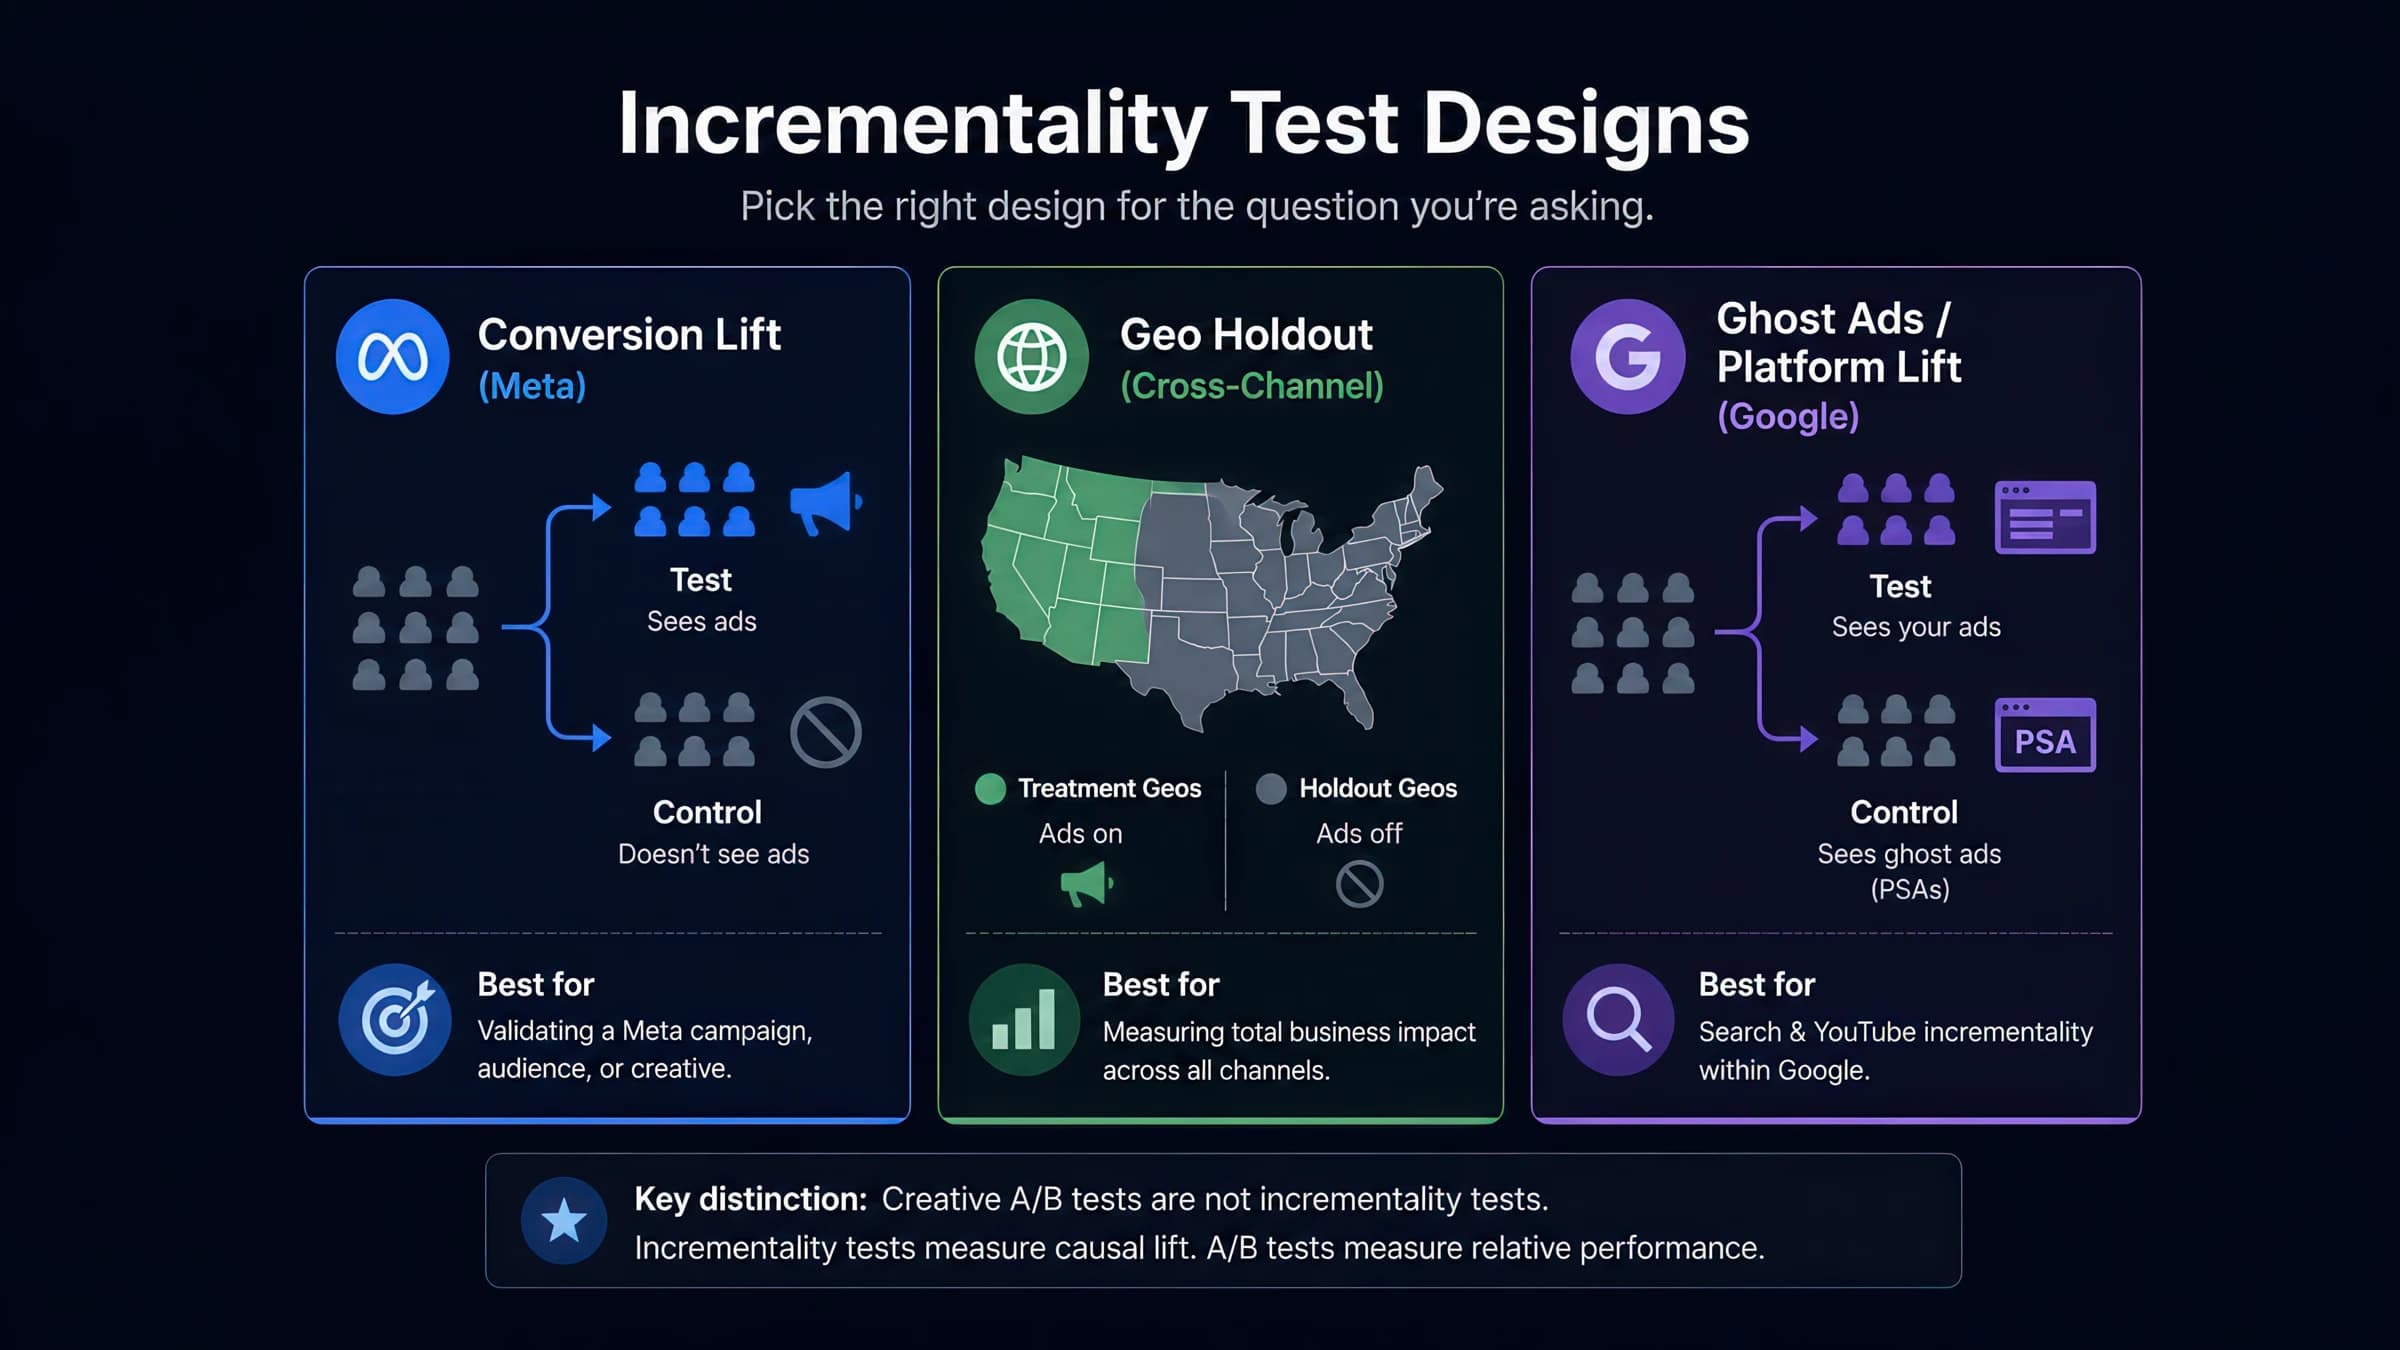
When ROAS rises but MER falls — or the team debates whether to cut prospecting — that is the trigger for a geo-holdout or conversion lift study. See our to model expected lift before you spend on the test.