Stay Updated
Get the latest insights on creative testing and ad optimization delivered to your inbox.
Get the latest insights on creative testing and ad optimization delivered to your inbox.
Continue reading about this topic with these recommended articles.
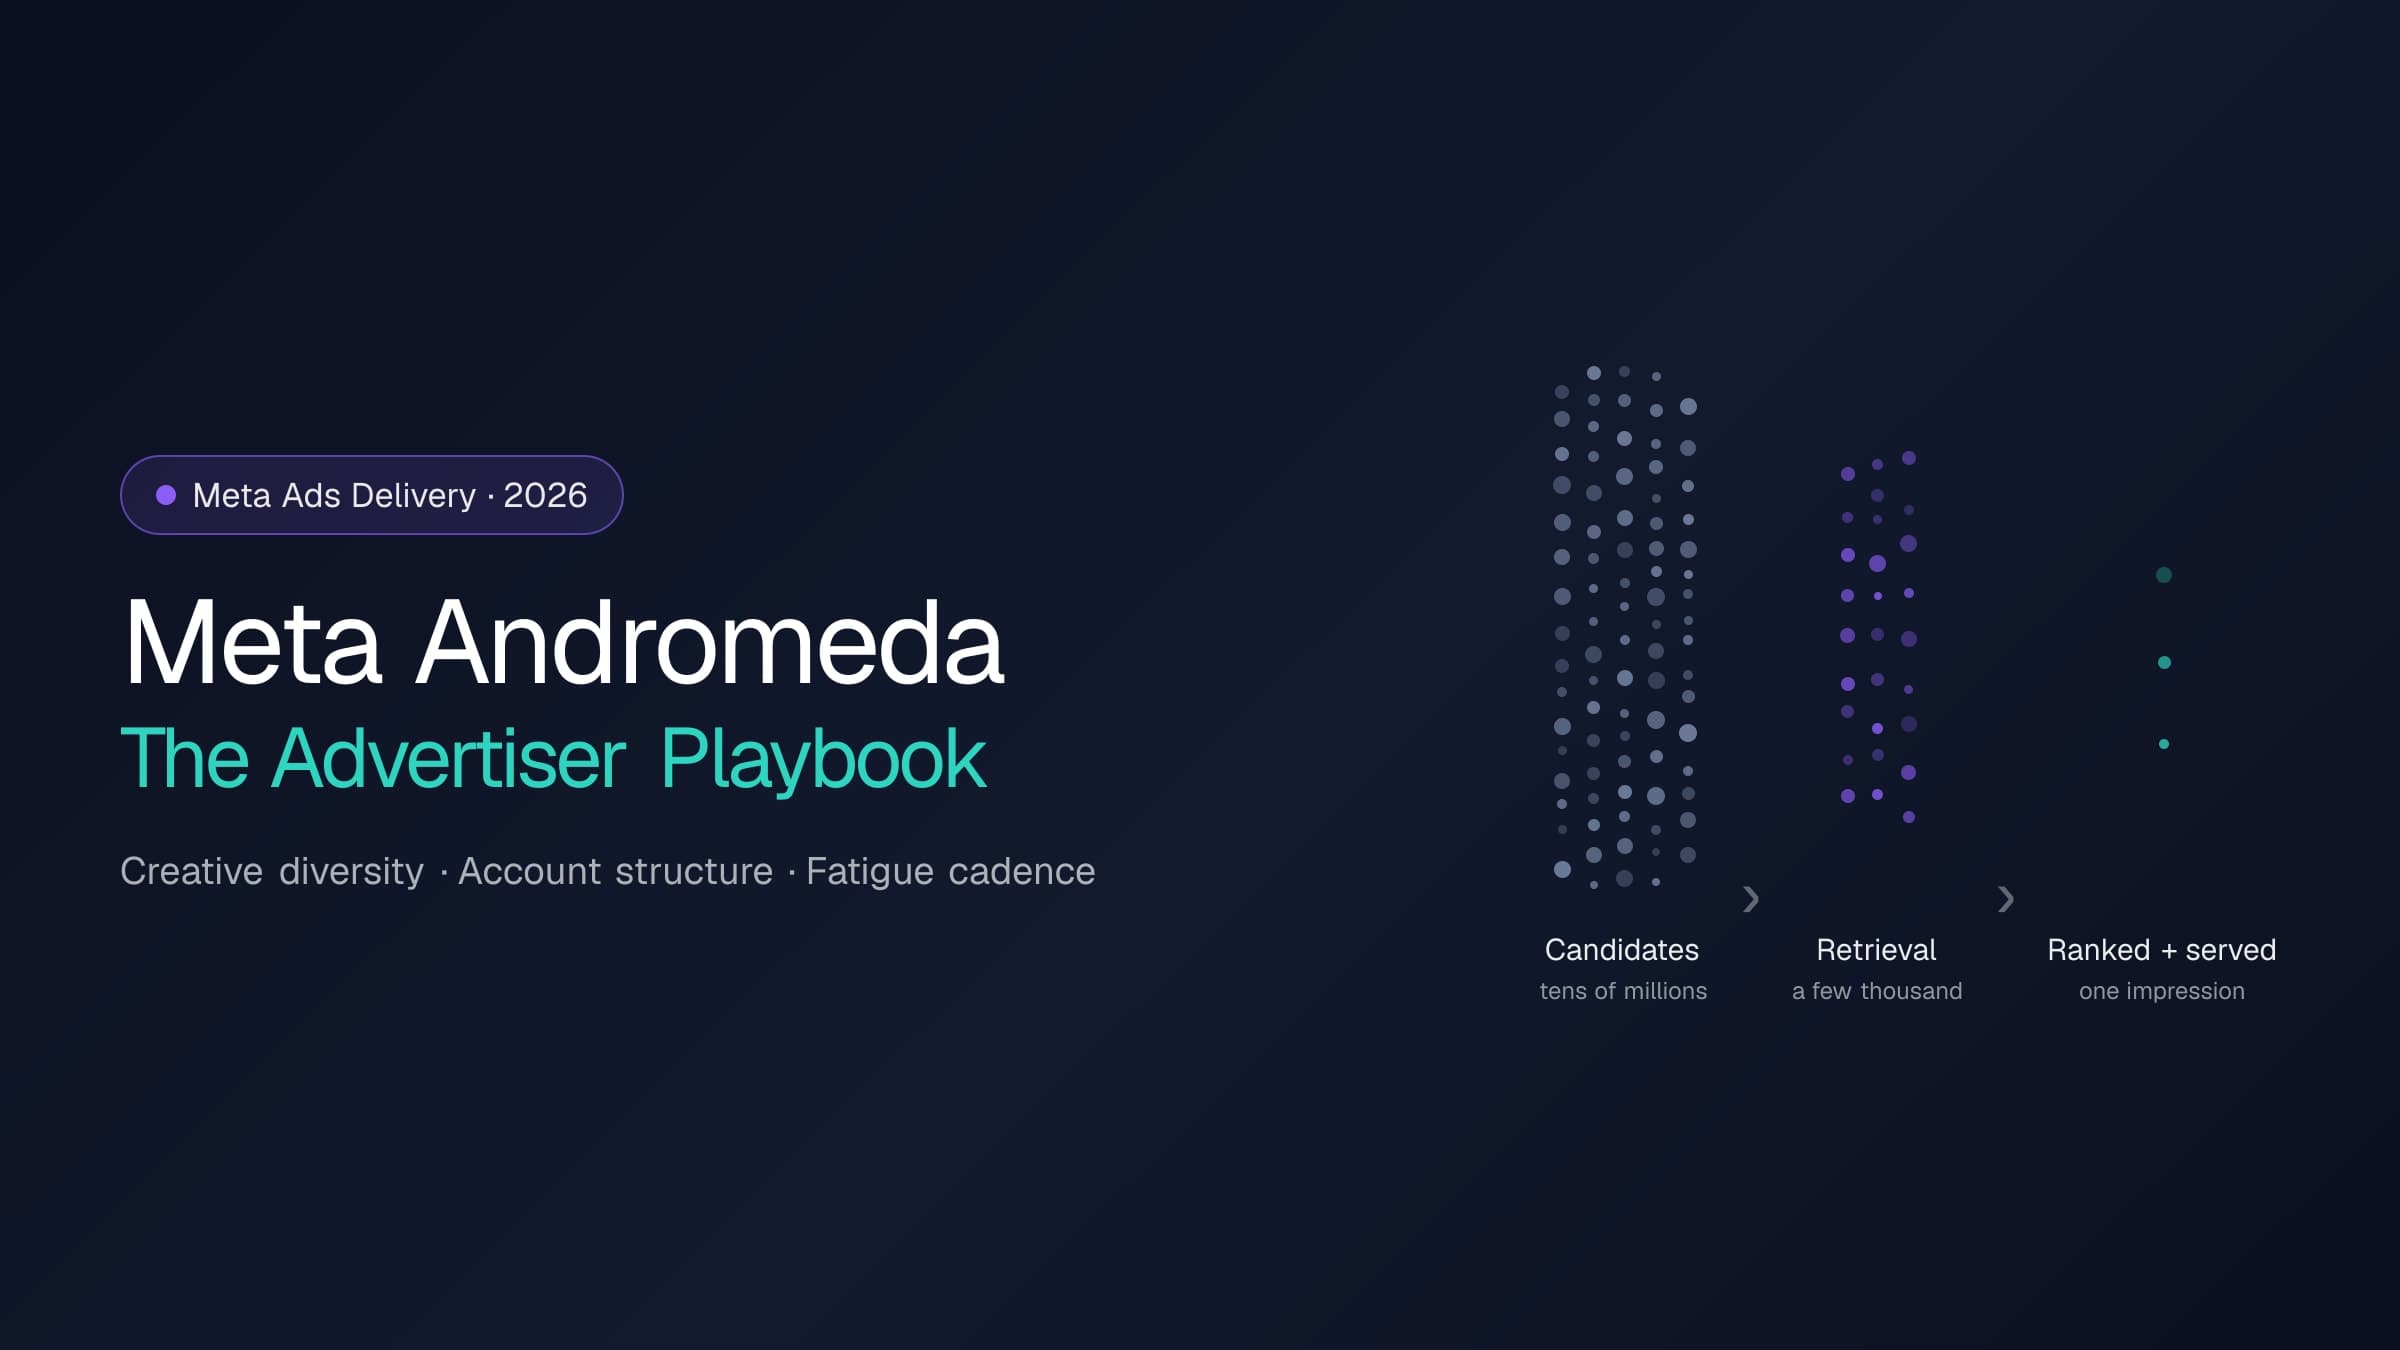
Andromeda rebuilt the retrieval stage of Meta's ads delivery; GEM and the Adaptive Ranking Model rebuilt ranking. Here is what actually changes for an operator: what to feed the system, how to structure the account, and how to run creative rotation — with every platform claim cited to Meta's own disclosures.

AI-powered marketing tools

Master the art of targeted ad creative with proven strategies for crafting personalized, high-converting ads across different audience segments, funnel stages, and demographics.
AI-powered marketing tools

Most Meta creative tests declare false winners. This playbook covers hypothesis design, Meta Experiments setup, sample-size math, and the three-metric read that separates signal from noise.
AI-powered marketing tools

Analyze audience drop-off and retention to find exactly where viewers stop watching your videos. Works for YouTube, Vimeo, TikTok, and Facebook analytics data.

Grade your ad creatives and get actionable recommendations for improvement. This creative quality grader tool evaluates key elements like visual design, messaging, CTAs, accessibility, and platform optimization to help you create high-performing ads across Facebook, Instagram, TikTok, and YouTube. Get detailed scores and personalized tips to optimize your creative strategy.
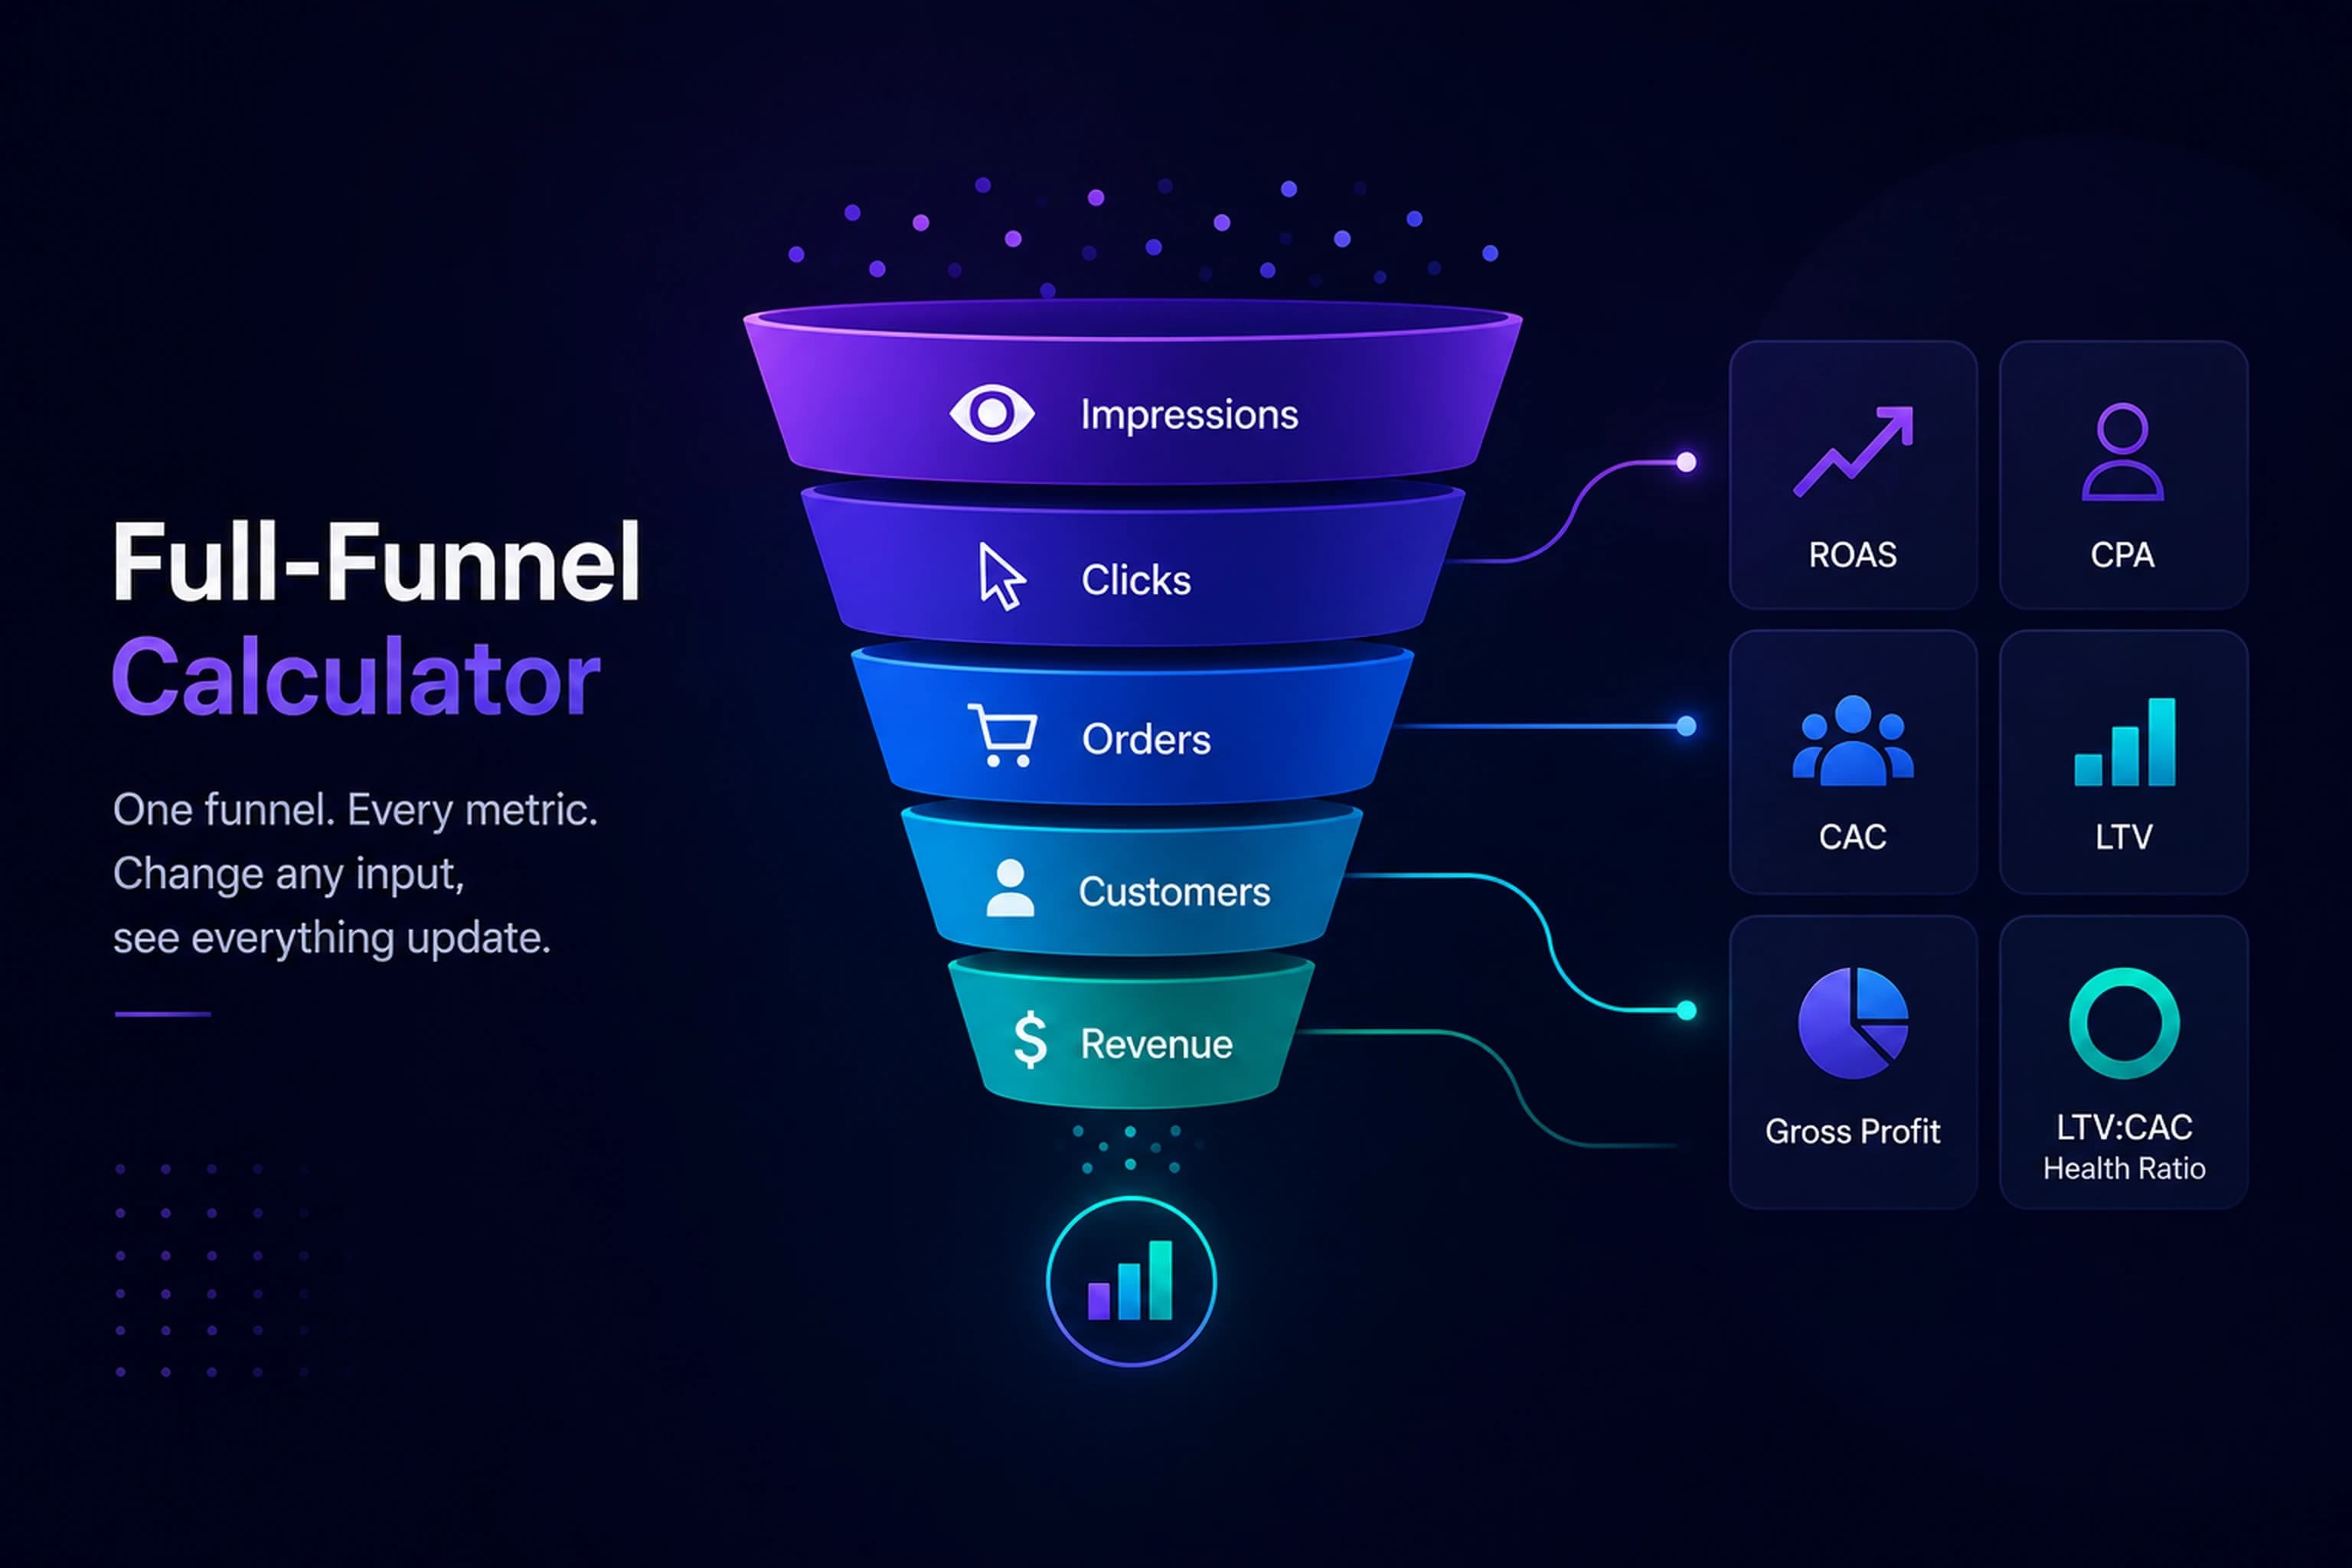
Model your entire paid-media funnel — impressions, CPM, CTR, CVR, and AOV — and instantly see ROAS, CPA, CAC, and LTV. Change any input to watch every downstream metric update, and gauge unit economics with an LTV:CAC health ratio.
Creative fatigue is a quantifiable phenomenon where ad performance metrics (like CTR, conversion rate, or ROAS) deteriorate as target audiences become overexposed to the same creative assets. This decline typically follows a predictable decay curve that accelerates with increased frequency and audience saturation. The impact varies by channel, format, and audience but generally manifests through decreased engagement and increased costs.
Click-Through Rate (CTR) measures the ratio of clicks to impressions for a digital advertisement, email, or other clickable content. It's a fundamental metric for evaluating creative relevance, audience targeting quality, and overall ad effectiveness in driving user engagement. CTR varies significantly by format, placement, and channel, making context crucial for performance evaluation.
Cost Per Mille (CPM) represents the cost an advertiser pays to deliver 1,000 ad impressions to their target audience. This metric is fundamental for media planning and buying, enabling comparison of advertising costs across different platforms, formats, and audience segments. CPM pricing reflects placement quality, audience targeting precision, and market demand.
Performance creative represents a data-driven approach to creative development where every design decision is informed by performance metrics and optimization goals. Unlike traditional creative focused primarily on brand expression, performance creative systematically tests and iterates on elements to maximize specific KPIs like conversion rate, ROAS, or engagement. This approach combines creative expertise with quantitative analysis to develop assets that consistently deliver measurable business results.
Meta only flags creative fatigue after cost per result doubles. Catch it 1–2 weeks earlier with frequency, CTR, and CPM thresholds — plus a worked example, detection checklist, and refresh-cadence framework.
Short answer: is the performance decay that sets in when the same people see the same ad too many times — and Meta's official "Creative fatigue" status only fires after cost per result has doubled. You can catch it one to two weeks earlier by watching three leading signals against your own baseline: frequency crossing roughly 2–2.5 on prospecting (7-day window), CTR down 20–25% sustained for 3+ days, and CPM creeping 15–20%+ with no auction event to explain it. The full detection thresholds, a worked week-by-week example with the math, and a refresh-cadence framework are below.
Every threshold in this post is a practitioner planning band, not a law of physics. Fatigue speed depends on audience size, spend velocity, vertical, and creative diversity — so the bands are calibrated to be useful defaults you then tighten against your own account history. Where a number comes from Meta's own documentation or published research, it's cited; where it's operator consensus, we say so.
Creative fatigue occurs when ad performance declines because the target audience has been overexposed to the same creative. The novelty that earned the first impressions' attention wears off; people scroll past an ad they've already mentally filed, engagement and click-through rate fall, and Meta's auction responds by charging you more to reach the same people — declining engagement lowers effective ad quality, which raises CPM, which compounds the cost damage.
The mechanism is well documented beyond platform folklore: a meta-analysis of 3,406 observations found ad repetition improves effectiveness up to a threshold, after which continued exposure produces diminishing and eventually negative returns. On Meta specifically, the compounding is what makes fatigue expensive: it is never just one metric decaying. Falling CTR and rising CPM multiply through to cost per click and , which is why an ad that "only" lost a quarter of its CTR can end up with double the CPA — the worked example below shows that math explicitly.
Meta's Ads Manager assigns two delivery sub-statuses when its system detects fatigue, both defined against your own account history for the same optimization event:
Two things follow from that definition. First, the official status is inherently lagging: by the time cost per result has doubled, you have already paid for weeks of degraded delivery. Second, it's relative to your own history, so a new account or a new optimization event has no baseline and gets no warning at all.
Meta's own analytics research points the same direction — that performance typically begins to decline after a frequency of roughly 3–4 for most direct-response campaigns, well before the cost-per-result doubling that triggers the official status. Treat the platform status as confirmation. Your alarm system should be the leading indicators below.
Detection is a portfolio exercise: no single metric is reliable on its own, but five signals read together against a trailing baseline catch fatigue one to two weeks before cost metrics blow out. The table gives the bands; the sections after it explain how to read each one.
These bands are operator consensus calibrated against Meta's published anchors — treat the boundaries as soft. What is not soft is the structure: a fatigue diagnosis needs at least two signals moving together. Rising frequency with falling CTR is fatigue. Rising CPM alone might be an auction change; falling CTR alone might be one bad day of placements.
Frequency counts average exposures per person; first-time impression ratio tells you what share of today's impressions reached someone new. They're two views of the same saturation process, and they're your only causal signals — everything else measures the audience's reaction, these measure the exposure itself. The practical read: when frequency passes ~2.5 on prospecting and the first-time impression ratio is trending down through ~50%, your delivery has shifted from reaching new people to re-serving the saturated core, and reaction metrics will start decaying within days.
Click-through rate is the cleanest reaction signal because it's high-volume (statistically stable at daily granularity for most budgets) and sits early in the funnel, ahead of conversion noise. Measure decay against the creative's own trailing 14-day baseline using a 3-day moving average — never single days. A sustained 20–25% decline is the practitioner action band; a 10–20% decline earns the creative a spot on the watch list and a replacement brief.
Meta's auction prices your impressions partly on predicted engagement. As a creative fatigues and engagement decays, its effective quality drops and CPM rises — you pay more per impression while each impression converts worse. That double-hit is why fatigue costs compound multiplicatively (the worked example below quantifies it). Before attributing CPM creep to fatigue, rule out the auction-side explanations: seasonal demand (Q4 CPMs rise account-wide), audience edits, and placement mix shifts.
For video creative, the decay sequence is predictable: thumbstop rate falls first (saturated viewers scroll on sight of a familiar opening frame), then ThruPlay rate and hold rate follow as fewer of the remaining viewers stay through the message. A hook-rate decline of 15%+ from the creative's own baseline typically leads CTR decline by several days — it's the earliest reaction signal you can get. You can sanity-check your hook rate against segmented benchmarks with the free Hook Rate Benchmark tool.
The fifth signal is the official one covered above — Creative limited and Creative fatigue statuses in Ads Manager. Fold them into your weekly review as confirmation, and treat any appearance of Creative limited as equivalent to two leading signals firing: Meta is telling you the cost damage has already started.
Daily ad metrics are noisy — especially decision-stage metrics like CPA and ROAS on high-AOV products, where a single large order can swing a day's numbers by 50%. Reacting to single-day drops produces false positives; the cure is to evaluate trends, not points.
The standard tool is the moving average: a 3-day window for fast-reacting signals like CTR and hook rate, and a 7- or 14-day window for conversion metrics. When the short window drops decisively below the long window and stays there, you're looking at a trend; when it dips and recovers, it was noise. The interactive below shows the same daily series smoothed at different windows — note how the 3-day average catches the inflection roughly a week before the 14-day average confirms it.
Abstract thresholds become concrete with numbers. Here is an illustrative — but structurally typical — four-week decay curve for a single cold-prospecting ad set spending a constant $3,500/week, with conversion rate drifting down slightly as fatigue attracts lower-intent clicks:
Walk the math and you can see why fatigue costs compound. Cost per click is CPM ÷ (1,000 × CTR), and CPA is cost per click ÷ conversion rate:
No single metric collapsed. CTR fell 38% over four weeks, CPM rose 27%, CVR slipped 12% — but because they multiply, CPA rose ~137%. This is also exactly when Meta's official status would appear: cost per result crosses the 2x line during week 4.
Now map the detection thresholds onto the timeline. In week 2, frequency crossed 2.5 and CTR was down 10.6% from baseline — two watch-band signals firing together, which is the moment to brief replacement creative. In week 3, CTR decay hit 25.4% ((1.42 − 1.06) ÷ 1.42), frequency passed 3, and CPM was up 15.5% — the act band. An operator acting on the week-3 signals instead of waiting for Meta's week-4 status saves most of a week of $65–90 CPAs; one acting on the week-2 watch signals has replacements through learning by the time the fatigued ad needs to be phased out. That one-to-two-week head start, repeated across every concept in an account, is the entire economic case for leading-indicator monitoring.
Run this weekly per ad set (daily above ~$5K/day spend). It takes about ten minutes in Ads Manager with a saved column set: frequency, CPM, CTR, first-time impression ratio (available as the reach-to-impressions view), hook rate, and delivery status.
Catalog campaigns (Advantage+ catalog ads, formerly dynamic product ads) fatigue differently, and the difference trips up a lot of operators: the products rotate automatically, so it feels like the creative is always fresh. It isn't. What fatigues is everything the catalog holds constant — the template, the format, the overlay styling, the headline pattern, and above all the experience of being followed by the same product grid.
The signs to watch, in rough order of reliability:
The fixes are template-side, since you can't refresh the products themselves: rotate the creative template (new overlay/frame styling, new headline structure), alternate formats (carousel ↔ collection), refresh the intro card on carousel units, tighten retargeting windows so pools cycle faster, and cap frequency where the objective allows it. Treat the catalog template like any other creative asset with its own fatigue clock — most teams refresh templates on roughly the same cadence band as their static prospecting creative.
The instinct when a creative fatigues is to pause it immediately. That's usually the most expensive possible response. Here is the playbook in order.
Before touching the creative, rule out the impostors: an account-wide CPM rise (seasonality or auction pressure — check whether non-fatigued ad sets show the same creep), a recent audience or placement edit, a landing-page or tracking change (CVR drop with stable CTR and frequency is not fatigue), and learning-phase resets from recent edits. Fatigue has a specific signature — rising exposure metrics plus decaying engagement metrics on a specific creative while others hold.
If a fatiguing creative still outperforms the ad set average, killing it creates a vacuum: Meta reallocates its spend to unproven creatives still in the learning phase, and performance drops sharply before it recovers — if it recovers. The strategic move is the substitution effect — a step beyond simple creative rotation: keep the fatigued winner running, launch replacements alongside it, and phase the winner out only when replacements have exited learning and proven themselves.
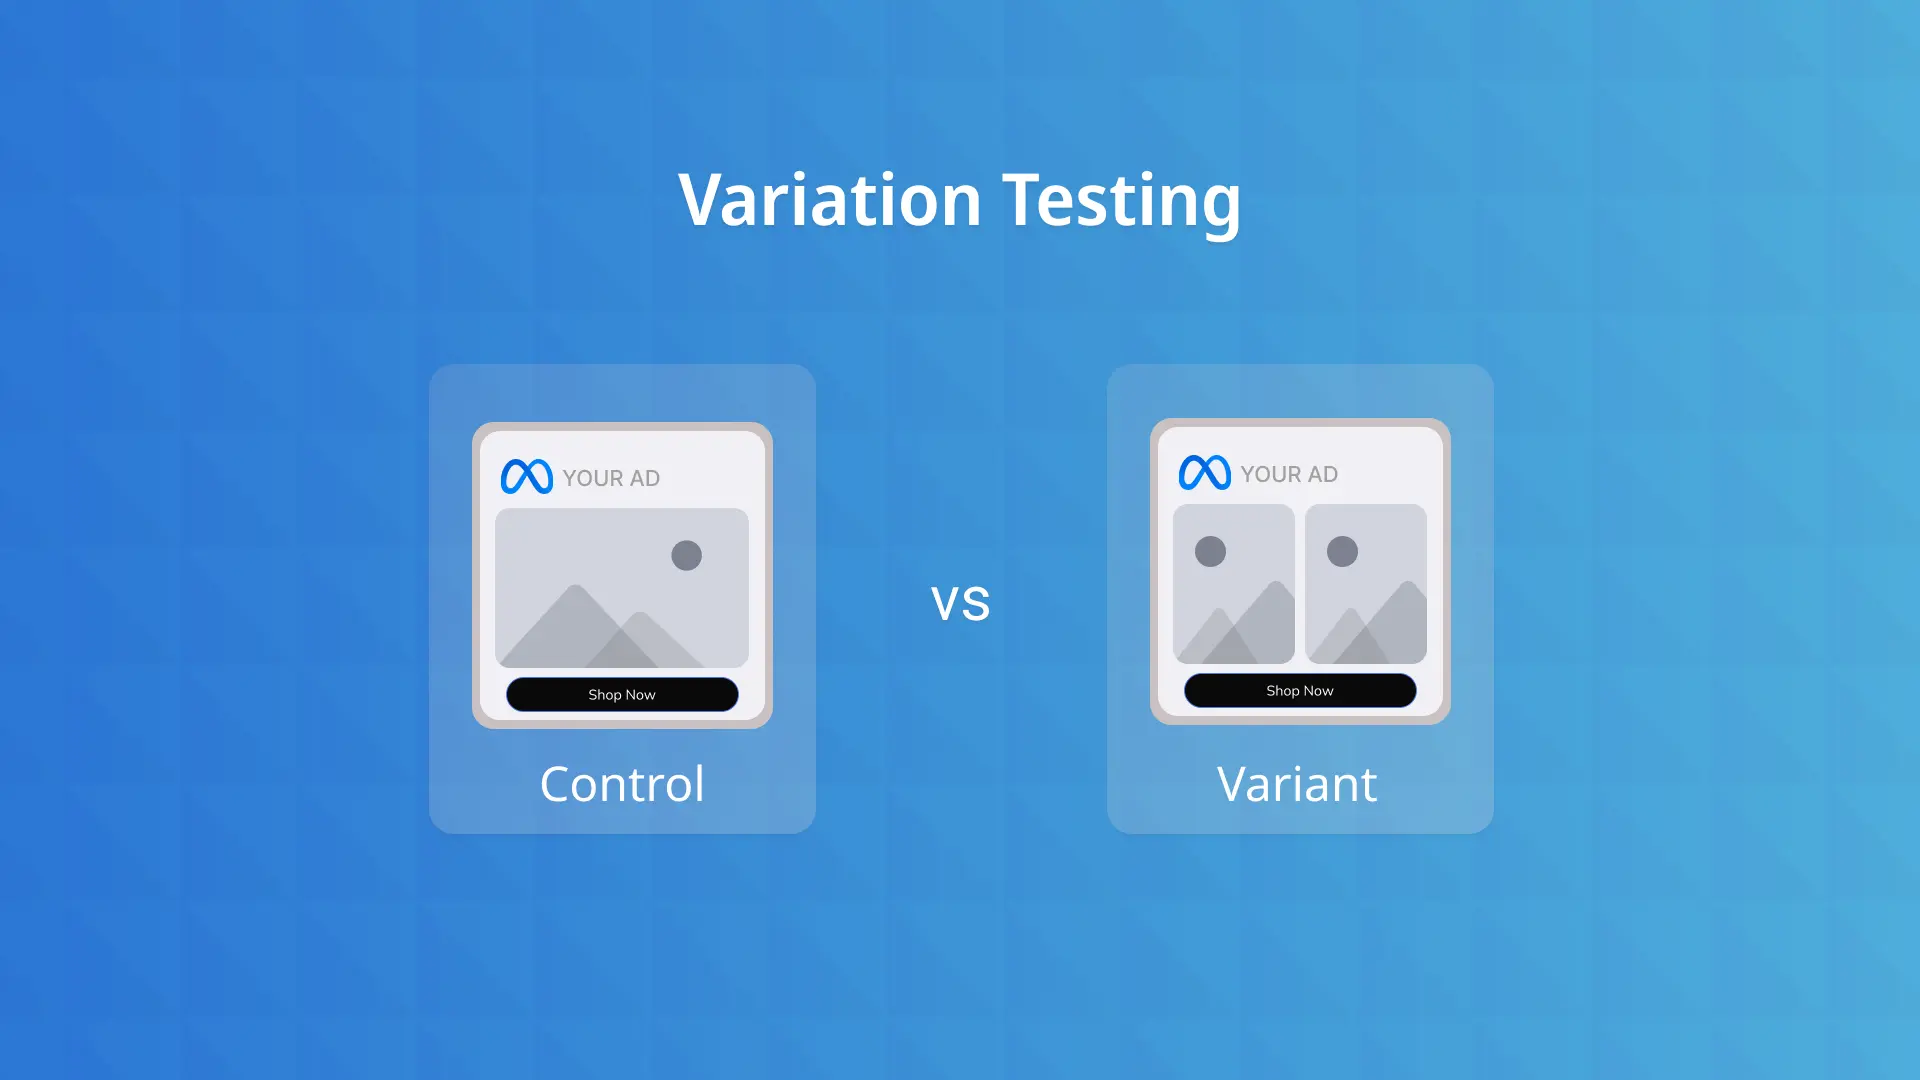
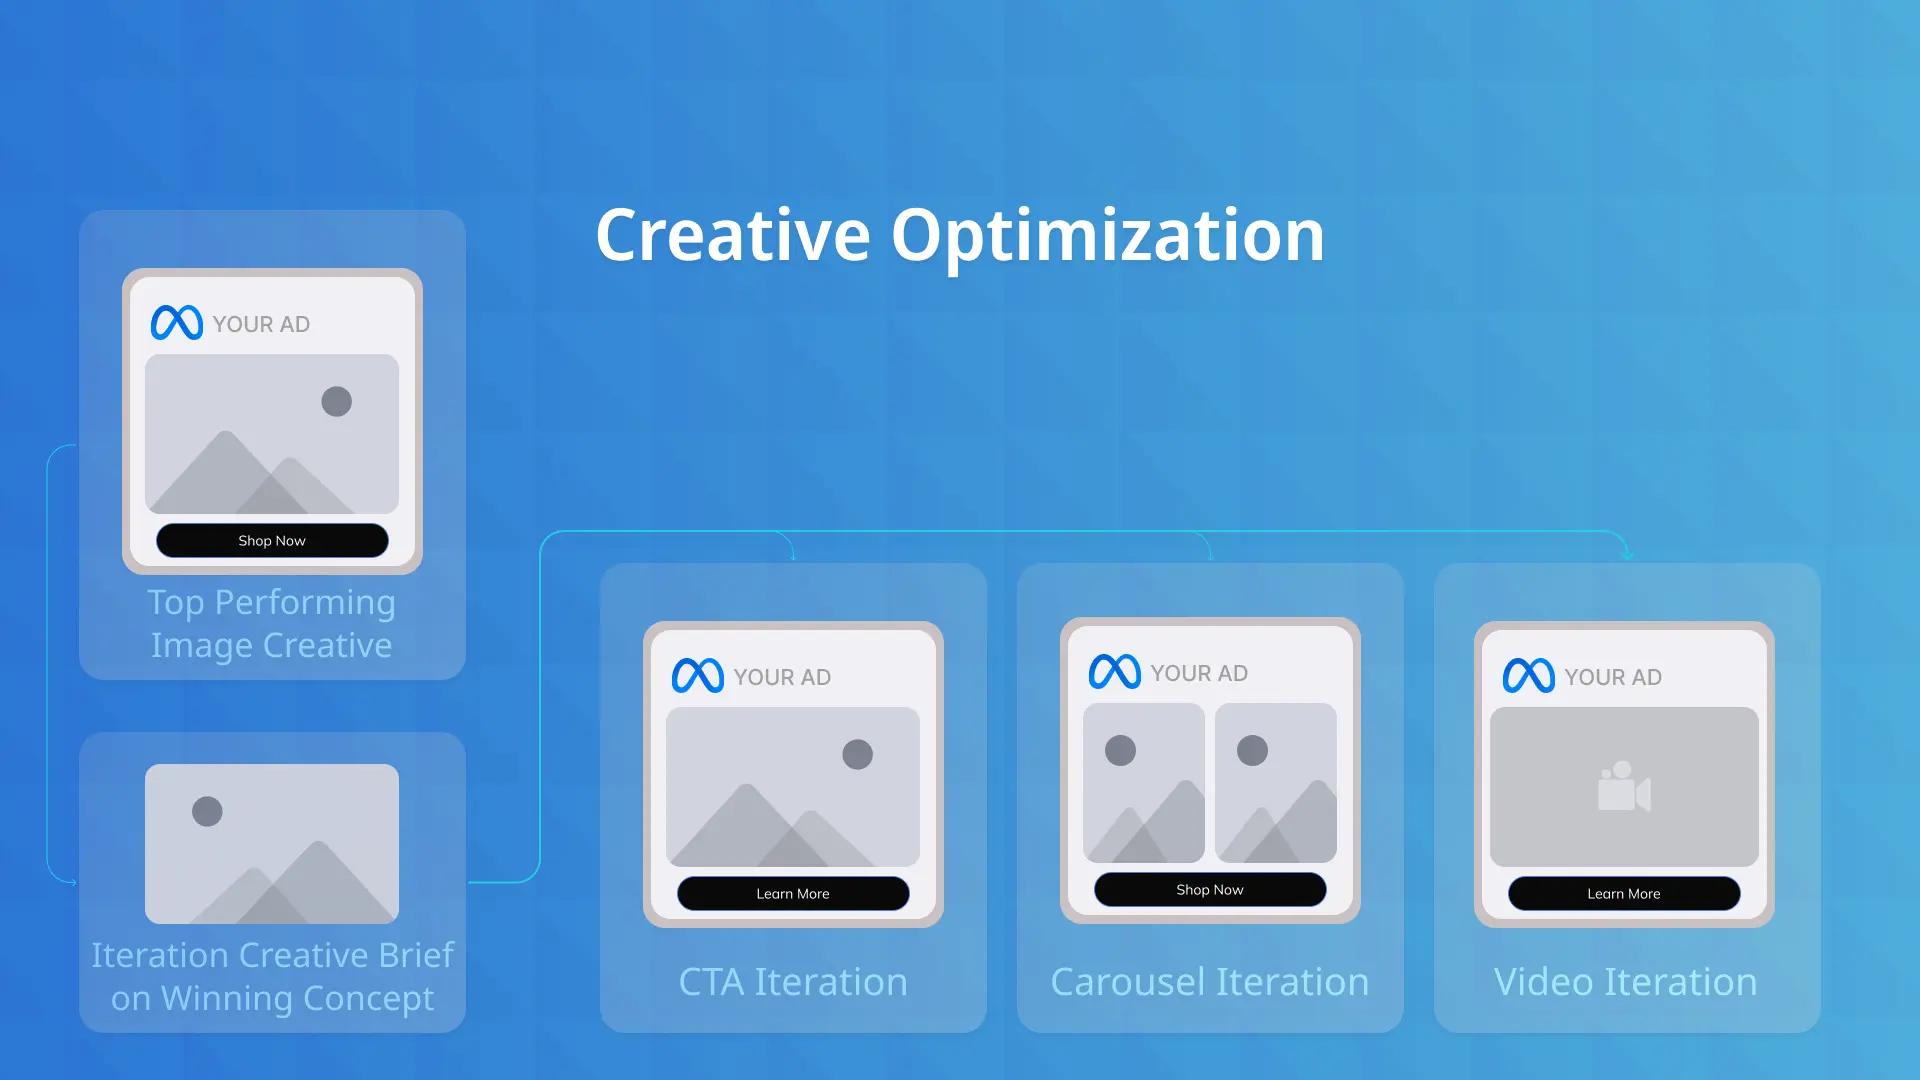
Not every refresh needs a net-new concept — and net-new concepts are the slowest, most expensive item in the pipeline. Order your refreshes by cost:
Run challengers through a structured test rather than tossing them into the ad set to fight for delivery — our guide to running a Meta creative test that actually proves something covers the design, and creative testing discipline is what keeps the replacement pipeline honest.
Creative refresh treats the symptom; exposure management slows the disease. Broaden targeting where performance allows (a larger pool means slower frequency accumulation at the same spend), use frequency caps where the objective exposes them (reach campaigns; awareness objectives), exclude recent converters and heavy-frequency segments from prospecting, and let dynamic creative or Advantage+ creative variations spread exposure across more combinations. On the dayparting question that occasionally comes up: it doesn't meaningfully prevent fatigue — cumulative exposures per person drive fatigue, and serving the same impressions in a narrower window doesn't reduce their count.
Substitution has a limit. Kill a creative outright when it underperforms the ad set average and its decay is steepening, when it carries a Creative fatigue status and challengers are through learning, or when its ROAS sits below breakeven on a 7-day window. At that point the vacuum risk is smaller than the guaranteed loss.
The honest answer: fatigue is exposure-driven, so cadence follows spend ÷ audience size, not the calendar. A concept's lifespan is roughly how long it takes your spend to push frequency through the fatigue bands against your addressable pool. That said, teams need planning numbers, and these bands hold up well as defaults across DTC and lead-gen accounts:
Three corrections to apply to your own account. If your audiences are unusually broad (Advantage+ audience, 20M+ pools), shift one band slower — exposure spreads thinner. If you lean on narrow retargeting or small custom audiences, shift one band faster. And once you have 8+ weeks of history, replace the table with your own measured number: the median weeks-to-act-band across your last dozen concepts is a better planning constant than any published default.
Manual weekly checks work up to a point; past a handful of ad sets, you want the monitoring automated. Three layers, in ascending order of sophistication:
Ads Manager custom columns and saved reports. Build a saved column set with frequency, CPM, CTR, hook rate, and delivery status, segmented by week. This makes the weekly checklist a five-minute scan instead of a spreadsheet exercise. Add the reach column and compute first-time impression trends from reach growth week over week.
Automated rules. Ads Manager rules can notify (better than auto-pausing, which bypasses the substitution logic) when frequency crosses your act band or when CTR falls below an absolute floor. Rules can't compare to a trailing baseline, so treat them as tripwires rather than diagnosis.
Purpose-built monitoring. The baseline-relative logic this post describes — each creative tracked against its own trailing performance with moving-average smoothing, decay flagged per-variant before blended metrics move — is exactly the analysis layer AdSights automates, alongside the creative-level diagnostics (hook, retention, and performance creative attributes) that tell you what to brief next, not just that something decayed.
Whichever layer you operate at, the decision logic stays the same:
Creative fatigue is not an anomaly to be avoided — it is the certain fate of every ad you will ever run. The performance difference between accounts is not whether their creative fatigues; it's how many weeks of degraded spend they absorb before responding. Meta's official status arrives after cost per result has doubled. The leading indicators — frequency past ~2.5 with a falling first-time impression ratio, CTR down 20%+ against its own baseline, CPM creeping without an auction excuse, hook rate decaying first on video — arrive one to two weeks earlier, and the worked example above prices that head start at most of the gap between a $38 CPA and a $90 one.
Detect with thresholds against your own baselines, confirm with two signals moving together, respond with substitution rather than execution, refresh at a cadence set by exposure rather than the calendar, and diversify concepts so the clock runs slower in the first place.
Signal | Healthy | Watch | Act | How to read it |
|---|---|---|---|---|
| Frequency (7-day) | Under ~2 | 2–3.5 | Over ~3.5–4 | Prospecting bands; retargeting tolerates roughly 5–8. Meta's research puts the typical decline onset at frequency 3–4. Always read alongside CTR — high frequency with stable CTR is less urgent. |
| CTR vs 14-day baseline | Within ±10% | Down 10–20% | Down 20–25%+ for 3+ days | Use a 3-day moving average, not single days. The most reliable single leading indicator for static and video creative alike. |
| CPM vs 14-day baseline | Within ±10% | Up 10–20% | Up 20%+ with no auction event | Rule out seasonality (Q4, sales events) and audience changes first — CPM creep only implicates fatigue when engagement is falling at the same time. |
| First-time impression ratio | Above ~60% | 40–60% and falling | Below ~40% | The share of impressions reaching new people — the inverse view of frequency. A collapsing ratio means you are mostly re-serving the saturated core. Directional bands; the trend matters more than t... |
| Hook rate (3s views ÷ impressions) | Within ±10% of the creative's own baseline | Down 10–15% | Down 15%+ sustained | Video-specific early warning: the hook decays first because saturated viewers scroll on sight. ThruPlay and hold rate follow. |
12.5% of total duration • 2m 0s total
Viewers who watched 95%+ of content
Daily ROAS with 10-day moving average and performance phases. This data illustrates the typical lifecycle of ad creative performance: initial stability, temporary dips, brief recovery, and eventual fatigue-driven decline. An interactive chart with additional features will load when JavaScript is available.
| Day | Daily ROAS | 10-Day Moving Average | Performance Phase |
|---|---|---|---|
| 1 | 4.00 | 4.00 | Stable Performance |
| 2 | 4.10 | 4.05 | Stable Performance |
| 3 | 4.17 | 4.09 | Stable Performance |
| 4 | 4.20 | 4.12 | Stable Performance |
| 5 | 4.18 | 4.13 | Stable Performance |
| 6 | 4.12 | 4.13 | Stable Performance |
| 7 | 4.03 | 4.11 | Stable Performance |
| 8 | 3.93 | 4.09 | Stable Performance |
| 9 | 3.85 | 4.06 | Stable Performance |
| 10 | 3.80 | 4.04 | Stable Performance |
| 11 | 3.81 | 4.02 | Stable Performance |
| 12 | 3.86 | 4.00 | Stable Performance |
| 13 | 3.00 | 3.88 | Initial Fatigue |
| 14 | 2.85 | 3.74 | Initial Fatigue |
| 15 | 2.70 | 3.60 | Initial Fatigue |
| 16 | 2.55 | 3.44 | Initial Fatigue |
| 17 | 3.20 | 3.36 | Recovery Attempt |
| 18 | 3.40 | 3.30 | Recovery Attempt |
| 19 | 3.60 | 3.28 | Recovery Attempt |
| 20 | 3.80 | 3.28 | Recovery Attempt |
| 21 | 3.80 | 3.28 | Progressive Decline |
| 22 | 3.68 | 3.26 | Progressive Decline |
| 23 | 3.56 | 3.31 | Progressive Decline |
| 24 | 3.44 | 3.37 | Progressive Decline |
ROAS trends across different time windows
3-Day MA
2.8
-12%7-Day MA
3.2
+8%14-Day MA
2.6
-15%28-Day MA
2.9
+2%Using moving averages helps smooth out daily fluctuations to reveal true performance trends
Demonstration of how moving averages smooth noisy data to reveal underlying trends. This table demonstrates how a 10-point moving average smooths volatile raw data to reveal the underlying directional trends. The raw values fluctuate significantly due to noise, while the moving average shows clearer patterns that are useful for decision-making. An interactive chart with adjustable parameters will load when JavaScript is available.
| Day | Raw Value | 10-Point Moving Average | Noise Level | Trend Direction |
|---|---|---|---|---|
| 1 | 51.01 | 51.01 | 0.00 | Falling |
| 2 | 50.77 | 50.89 | 0.12 | Falling |
| 3 | 54.85 | 52.21 | 2.64 | Rising |
| 4 | 54.02 | 52.66 | 1.36 | Rising |
| 5 | 50.40 | 52.21 | 1.81 | Falling |
| 6 | 53.23 | 52.38 | 0.85 | Rising |
| 7 | 50.94 | 52.17 | 1.23 | Falling |
| 8 | 53.27 | 52.31 | 0.96 | Rising |
| 9 | 54.91 | 52.60 | 2.31 | Rising |
| 10 | 51.49 | 52.49 | 1.00 | Falling |
| 11 | 49.59 | 52.35 | 2.76 | Falling |
| 12 | 54.75 | 52.75 | 2.00 | Rising |
| 13 | 54.07 | 52.67 | 1.40 | Falling |
| 14 | 51.29 | 52.39 | 1.10 | Falling |
| 15 | 51.42 | 52.50 | 1.08 | Rising |
| 16 | 55.05 | 52.68 | 2.37 | Rising |
| 17 | 57.83 | 53.37 | 4.46 | Rising |
| 18 | 58.47 | 53.89 | 4.58 | Rising |
| 19 | 54.12 | 53.81 | 0.31 | Falling |
| 20 | 58.10 | 54.47 | 3.63 | Rising |
| 21 | 60.98 | 55.61 | 5.37 | Rising |
| 22 | 54.32 | 55.57 | 1.25 | Falling |
| 23 | 58.01 | 55.96 | 2.05 | Rising |
| 24 | 52.70 | 56.10 | 3.40 | Rising |
Week | Frequency (7d) | CPM | Impressions | CTR | Clicks | CVR | Conversions | CPA |
|---|---|---|---|---|---|---|---|---|
| 1 | 1.9 | $14.20 | 246,500 | 1.42% | 3,500 | 2.6% | 91 | $38 |
| 2 | 2.5 | $15.00 | 233,300 | 1.27% | 2,963 | 2.5% | 74 | $47 |
| 3 | 3.2 | $16.40 | 213,400 | 1.06% | 2,262 | 2.4% | 54 | $65 |
| 4 | 3.9 | $18.10 | 193,400 | 0.88% | 1,702 | 2.3% | 39 | $90 |
Creative fatigue follows predictable stages. Early detection through engagement metrics allows proactive management before conversion impact occurs. An interactive flowchart with visual connections and detailed explanations will load when JavaScript is available.
Prospecting past 2.5 and climbing = watch; past 3.5 = act. Retargeting: apply the 5–8 band instead.
Falling through ~50% means delivery has shifted to re-serving the saturated core.
Down 10–20% = brief replacements; down 20–25%+ sustained 3+ days = start the substitution.
Up 15–20%+ with falling engagement and no auction event (seasonality, audience edits) implicates fatigue.
Down 15%+ is the earliest reaction signal — it usually leads CTR decline by several days.
'Creative limited' or 'Creative fatigue' = the lagging confirmation; the cost damage has already started.
One decaying metric is a hypothesis; two moving together (exposure + reaction) is a diagnosis.
This analysis compares gradual creative transitions versus abrupt switches. The data shows how weaning budget allocation between fatigued and new creatives can optimize overall ROAS during transitions. Table shows daily ROAS and allocation share to new creative compared to fatigued creative. An interactive chart with controls will load when JavaScript is available.
| Day | New Creative Share (Weaned) | Fatigued ROAS | New Creative ROAS | Weaned Strategy ROAS | Abrupt Switch ROAS |
|---|---|---|---|---|---|
| 1 | 0.00 | 3.93 | 0.00 | 3.93 | 3.93 |
| 2 | 0.00 | 4.02 | 0.00 | 4.02 | 4.02 |
| 3 | 0.00 | 4.03 | 0.00 | 4.03 | 4.03 |
| 4 | 0.00 | 4.09 | 0.00 | 4.09 | 4.09 |
| 5 | 0.00 | 3.94 | 0.00 | 3.94 | 3.94 |
| 6 | 0.00 | 4.03 | 0.00 | 4.03 | 4.03 |
| 7 | 0.00 | 3.89 | 0.00 | 3.89 | 3.89 |
| 8 | 0.00 | 3.77 | 0.00 | 3.77 | 3.77 |
| 9 | 0.12 | 3.68 | 0.30 | 3.27 | 0.30 |
| 10 | 0.14 | 3.58 | 0.30 | 3.12 | 0.30 |
| 11 | 0.16 | 3.48 | 0.48 | 3.00 | 0.48 |
| 12 | 0.18 | 3.36 | 0.30 | 2.81 | 0.30 |
| 13 | 0.20 | 3.28 | 0.51 | 2.73 | 0.51 |
| 14 | 0.22 | 3.21 | 0.33 | 2.58 | 0.33 |
| 15 | 0.24 | 3.15 | 0.54 | 2.53 | 0.54 |
| 16 | 0.26 | 3.06 | 0.76 | 2.46 | 0.76 |
| 17 | 0.28 | 3.09 | 0.82 | 2.45 | 0.82 |
| 18 | 0.30 | 3.01 | 0.98 | 2.40 | 0.98 |
| 19 | 0.32 | 2.93 | 1.03 | 2.32 | 1.03 |
| 20 | 0.34 | 2.92 | 1.07 | 2.29 | 1.07 |
| 21 | 0.36 | 2.85 | 1.07 | 2.21 | 1.07 |
| 22 | 0.38 | 2.84 | 1.11 | 2.18 | 1.11 |
| 23 | 0.40 | 2.86 | 1.11 | 2.16 | 1.11 |
| 24 | 0.42 | 2.86 | 1.17 | 2.15 | 1.17 |
Introduce 2–4 new variants alongside the fatigued winner while it still carries the ad set
Compare challengers against the incumbent on post-learning data, not day-one numbers
Shift spend gradually once a challenger sustains equal-or-better performance

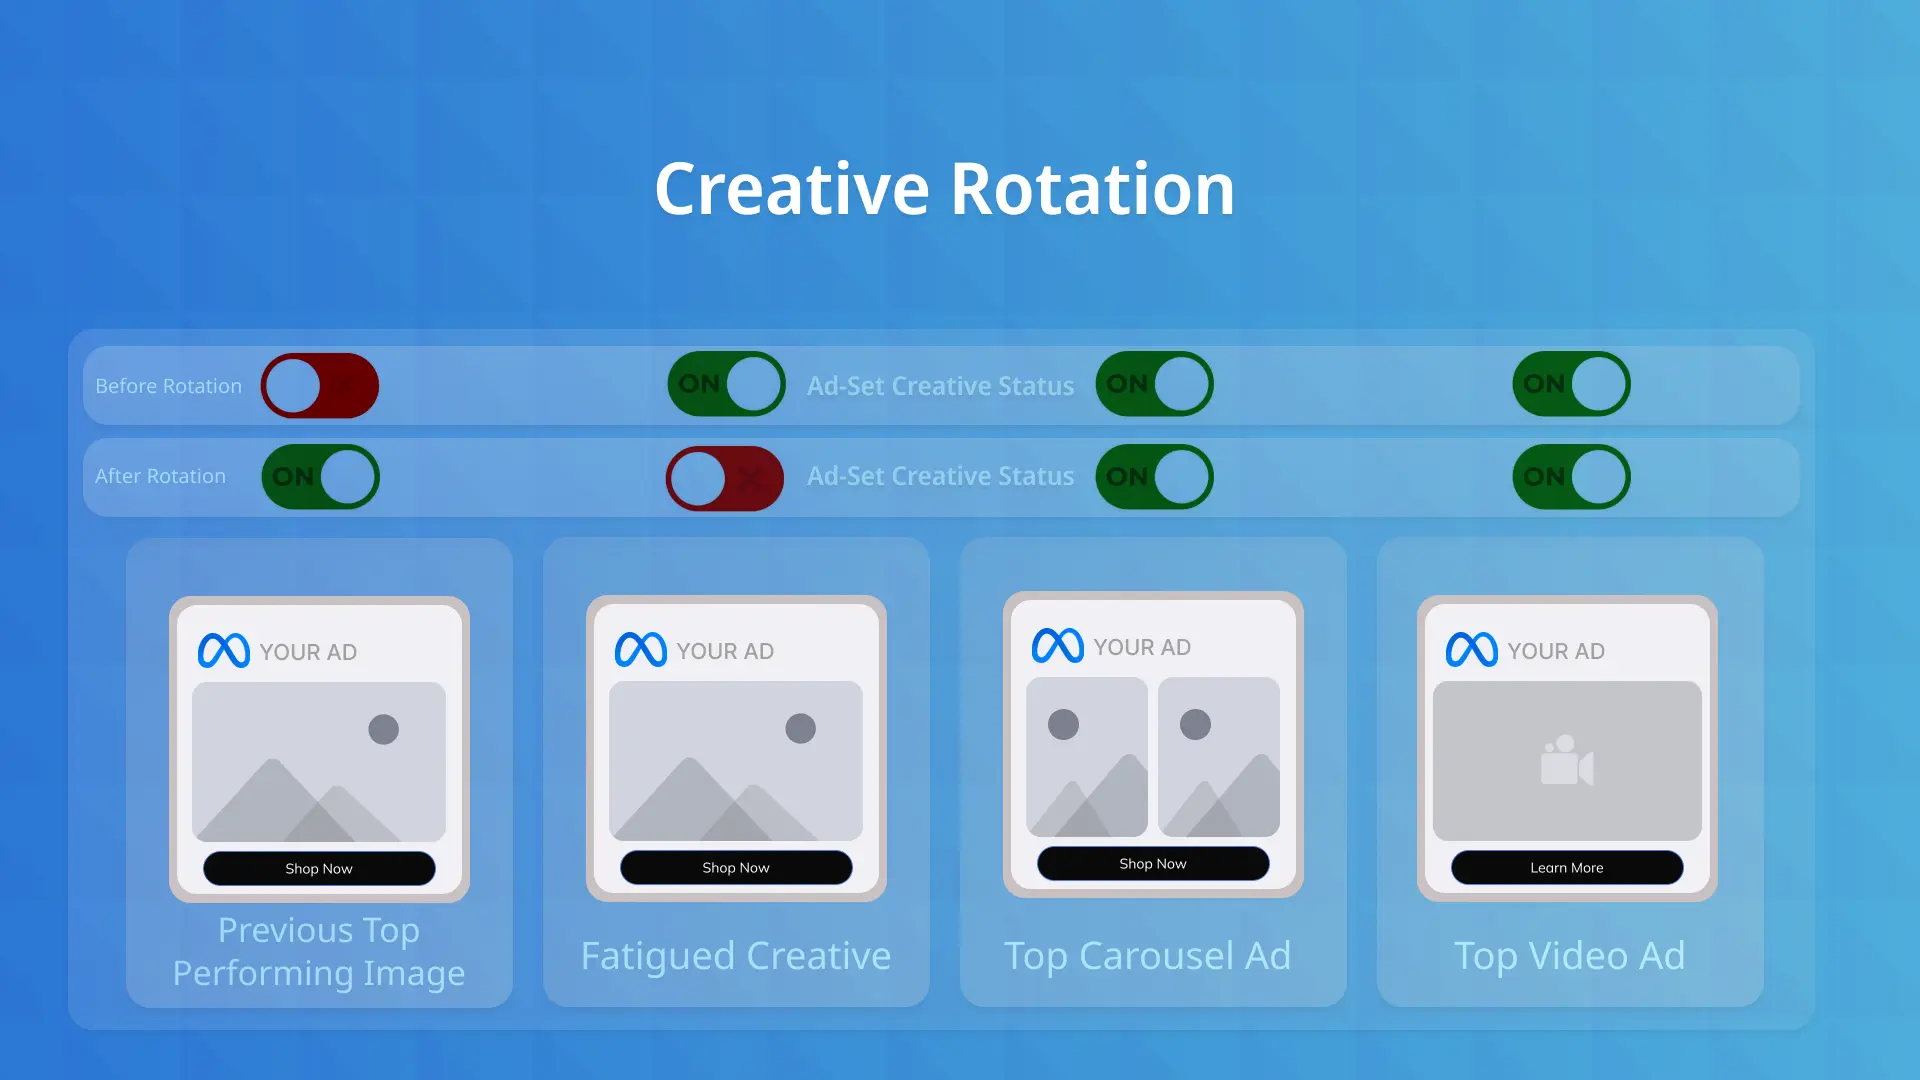
Creative Rotation



Monthly Meta spend | Typical concept lifespan | Review cadence | New-creative pipeline |
|---|---|---|---|
| Under $10K | 6–12 weeks | Monthly | 2–4 new variants/month; iterations usually suffice, net-new concepts quarterly. |
| $10K–$50K | 4–8 weeks | Bi-weekly | 4–8 new variants/month; at least one net-new concept in test at all times. |
| $50K–$250K | 2–6 weeks | Weekly | 8–16 new variants/month; structured testing lane separate from scaling ad sets. |
| $250K+ (or narrow retargeting) | 1–3 weeks | Continuous (dashboarded) | 15+ new variants/month; always-on production pipeline with hook/format/angle laddering. |
Use this interactive decision tree to determine the optimal strategy when your advertising creative shows signs of fatigue. Follow the paths to identify whether to continue, optimize, or replace your creative assets.

