Guide
Benchmarks & how to read your result
How to read and act on your result — research-backed context with linked sources for every benchmark cited.
How eCommerce ROAS is Calculated
ROAS = Revenue ÷ Ad Spend
Enter your total ad spend, cost per click, store conversion rate, and average order value. The calculator derives clicks, orders, revenue, and ROAS for you. Because the eCommerce tab treats every conversion as an immediate sale, the result maps directly to your Shopify and ad-platform revenue.
Worked example: Shopify store on Meta
A DTC skincare brand runs Meta prospecting:
- Ad spend: $15,000
- CPC: $1.25 → 12,000 clicks
- Store conversion rate: 2.5% → 300 orders
- Average order value: $68 → $20,400 revenue
- ROAS = $20,400 ÷ $15,000 = 1.36×
At 45% gross margin, break-even ROAS = 1 ÷ 0.45 = 2.22× — this campaign loses money on a margin basis despite generating sales. The fix is margin, conversion rate, or AOV — not blindly chasing a 4× industry average.
ROAS benchmarks by ecommerce vertical (2025)
Health & Supplements
- Median ROAS
- 5.7×
- Source
- TrueProfit / Varos DTC benchmarks
Home & Garden
- Median ROAS
- 5.5×
Beauty & Cosmetics
- Median ROAS
- 3.25×
- Source
- EcomHint 2025
General ecommerce
- Median ROAS
- 2.87×
Electronics
- Median ROAS
- 2.5×
| Vertical | Median ROAS | Source |
|---|---|---|
| Health & Supplements | 5.7× | TrueProfit / Varos DTC benchmarks |
| Home & Garden | 5.5× | EcomHint 2025 vertical compilation |
| Beauty & Cosmetics | 3.25× | EcomHint 2025 |
| General ecommerce | 2.87× | EcomHint 2025 platform average |
| Electronics | 2.5× | WordStream / LocaliQ 2024 |
ROAS benchmarks by ad platform (eCommerce)
Meta (prospecting)
- Typical ROAS range
- 2.0× – 4.0×
- Notes
- EcomHint avg ~2.2×
Meta (retargeting)
- Typical ROAS range
- 3.5× – 6.0×
- Notes
- EcomHint retargeting ~3.61×
Google Shopping
- Typical ROAS range
- 3.0× – 8.0×
- Notes
- High purchase intent
TikTok Shop / TikTok ads
- Typical ROAS range
- 1.4× – 3.0×
- Notes
- EcomHint avg ~1.4×
Google Search (brand)
- Typical ROAS range
- 6.0× – 12.0×
- Notes
- Often inflated — check incrementality
| Platform | Typical ROAS range | Notes |
|---|---|---|
| Meta (prospecting) | 2.0× – 4.0× | EcomHint avg ~2.2× |
| Meta (retargeting) | 3.5× – 6.0× | EcomHint retargeting ~3.61× |
| Google Shopping | 3.0× – 8.0× | High purchase intent |
| TikTok Shop / TikTok ads | 1.4× – 3.0× | EcomHint avg ~1.4× |
| Google Search (brand) | 6.0× – 12.0× | Often inflated — check incrementality |
How to calculate ROAS for Shopify
- Shopify Admin → Analytics → Marketing → note channel spend and attributed sales (match your attribution window).
- Meta Ads Manager → Purchase conversion value for the same date range and attribution window (1-day click vs 7-day click matters).
- Enter spend and revenue in this calculator; add gross margin on the Target ROAS Calculator to check break-even.
- Compare realized ROAS to the vertical row above — not a generic "4× is good" rule.
Shopify vs Meta ROAS discrepancy
Platform-reported ROAS often differs from Shopify by 20–40% when attribution windows, view-through conversions, or duplicate pixel fires diverge. Use MER (total revenue ÷ total marketing spend) for strategic truth and per-campaign ROAS for tactical decisions. See the MER Calculator.
Common mistakes
- Treating Meta ROAS as Shopify revenue. Different attribution windows create false confidence.
- Blending prospecting and retargeting ROAS. Retargeting inflates the blended number.
- Ignoring returns and refunds in revenue — net revenue lowers realized ROAS.
- Using industry 4× as target when 30% margins need 3.33× just to break even.
- Scaling on platform ROAS while MER flatlines — classic attribution overlap symptom.
How to improve eCommerce ROAS
- Optimize product landing pages and checkout conversion rate.
- Increase AOV with bundles, upsells, and free-shipping thresholds.
- Negative keywords and audience exclusions on paid search and social.
- Separate prospecting vs retargeting reporting and budgets.
- Refresh creative before raising bids — CPM inflation is a ROAS killer.
- Run incrementality holdouts before doubling budget on "winning" campaigns.
Methodology & sources
Vertical medians are compiled from DTC operator reports (2025). Compare each row to your break-even ROAS — a 5.7× supplement median is meaningless at 20% gross margin.
Vertical and platform ROAS composites
WordStream & LocaliQ Benchmarks
Electronics and general e-commerce baselines
Shopify operator ROAS ranges
eCommerce ROAS Calculator
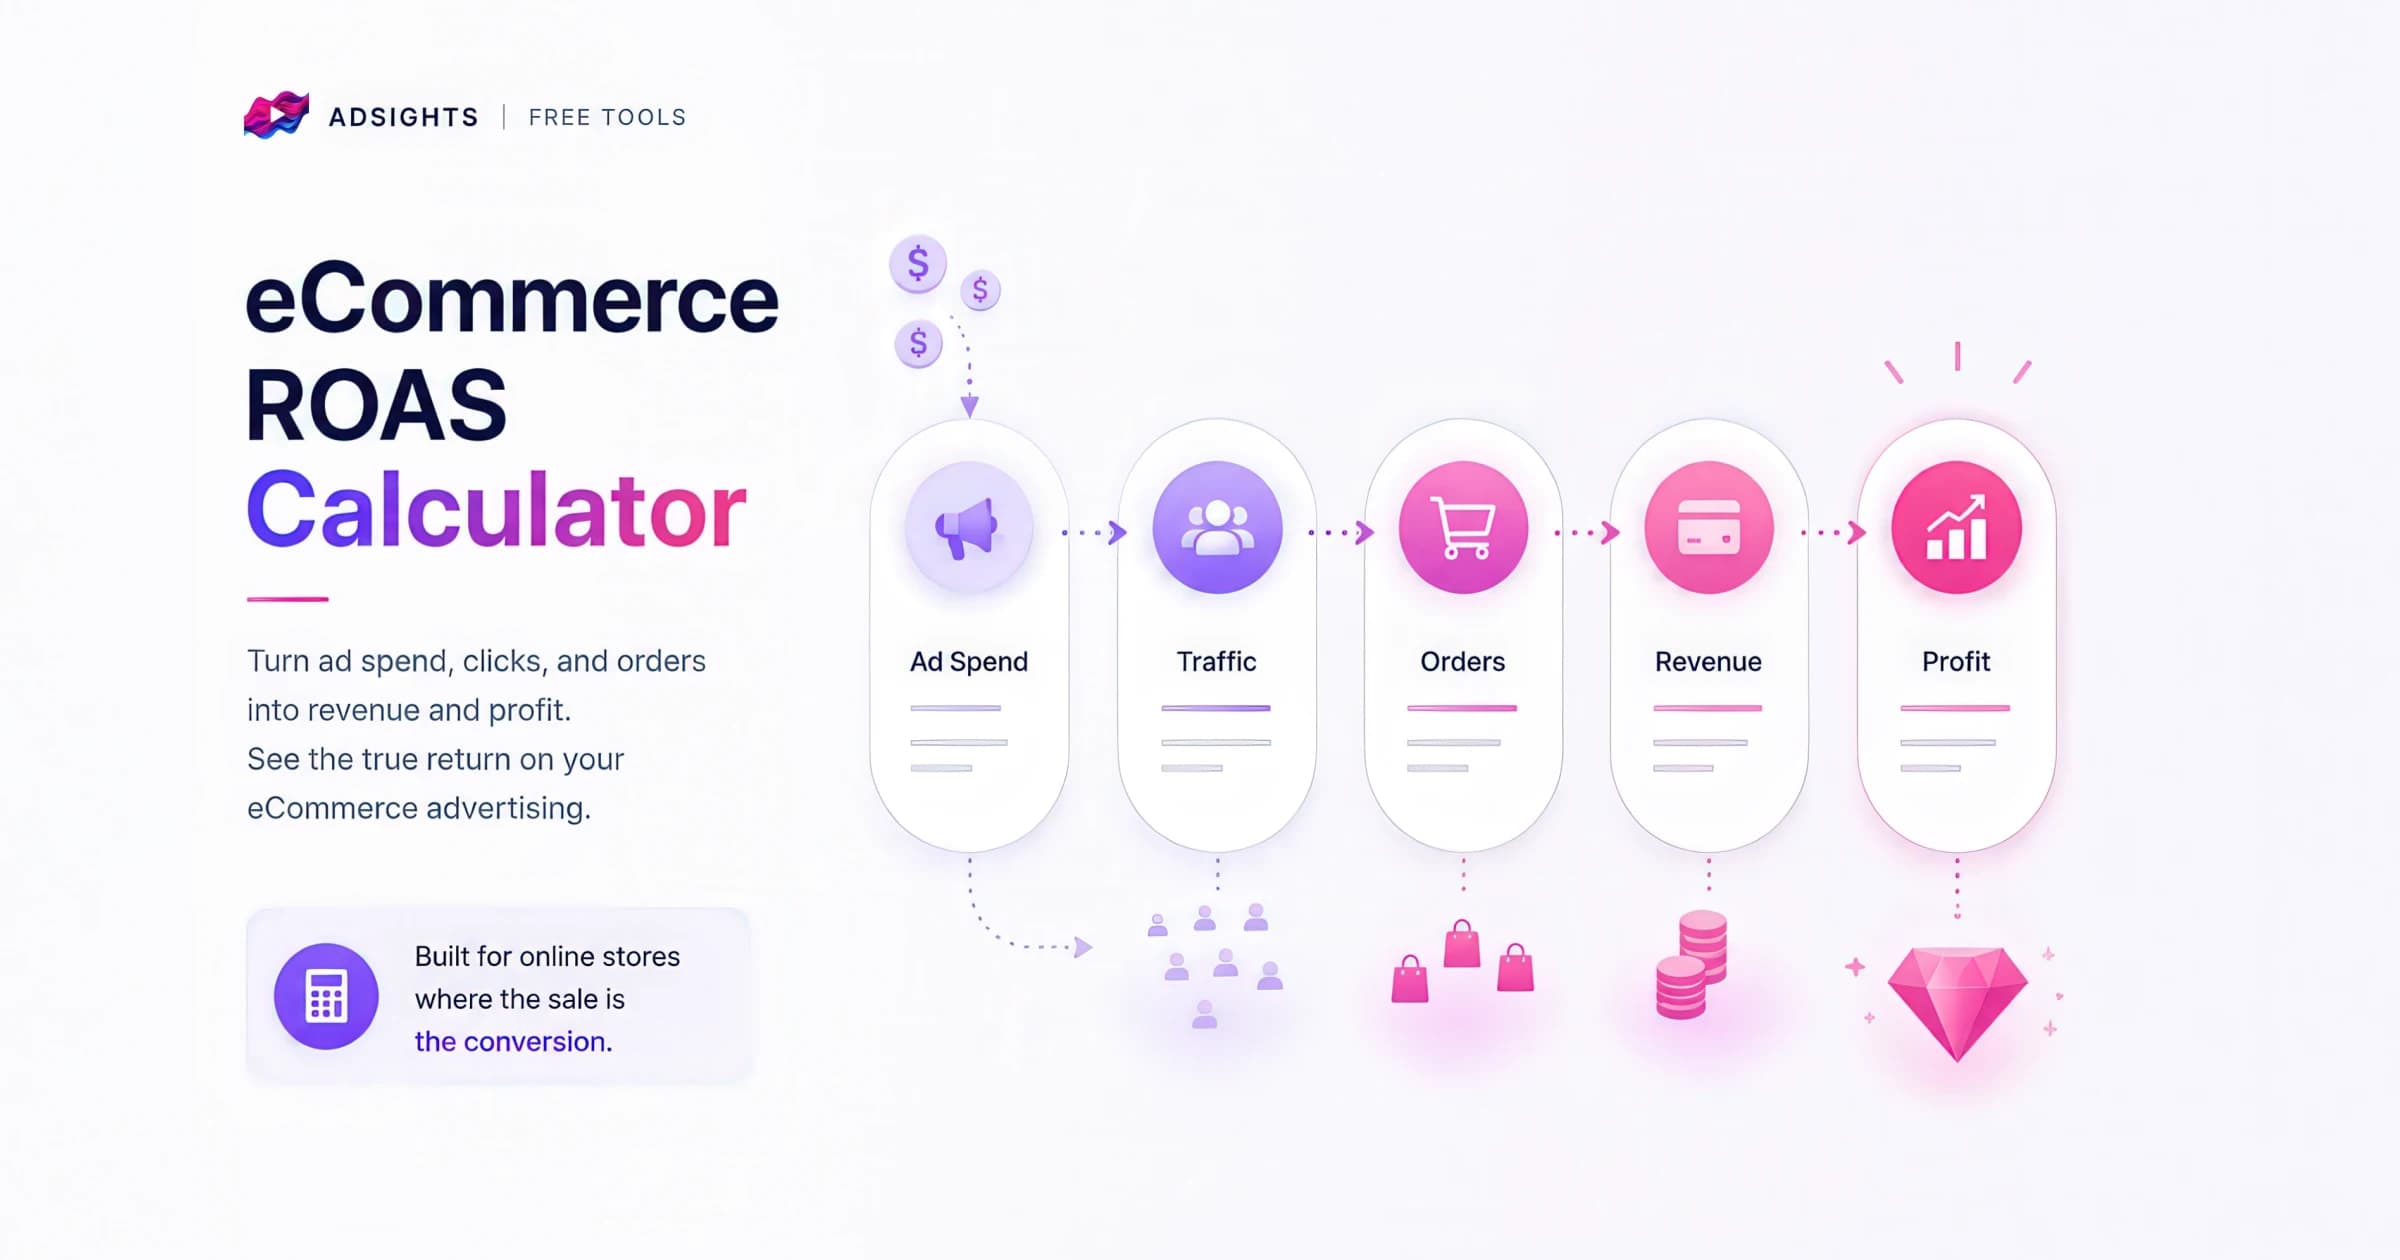
Free eCommerce ROAS calculator for online stores: turn ad spend, click cost, conversion rate, and average order value into return on ad spend and profit. Built for Shopify, DTC, and online-store paid media where the sale is the conversion.
Free Calculator
No sign up required. Use this calculator as much as you need.
Stop calculating by hand
Want AI to track this across every creative variant — and tie it back to ROAS automatically? That’s what AdSights does.
Request early accessRelated Calculators
Full-Funnel Calculator
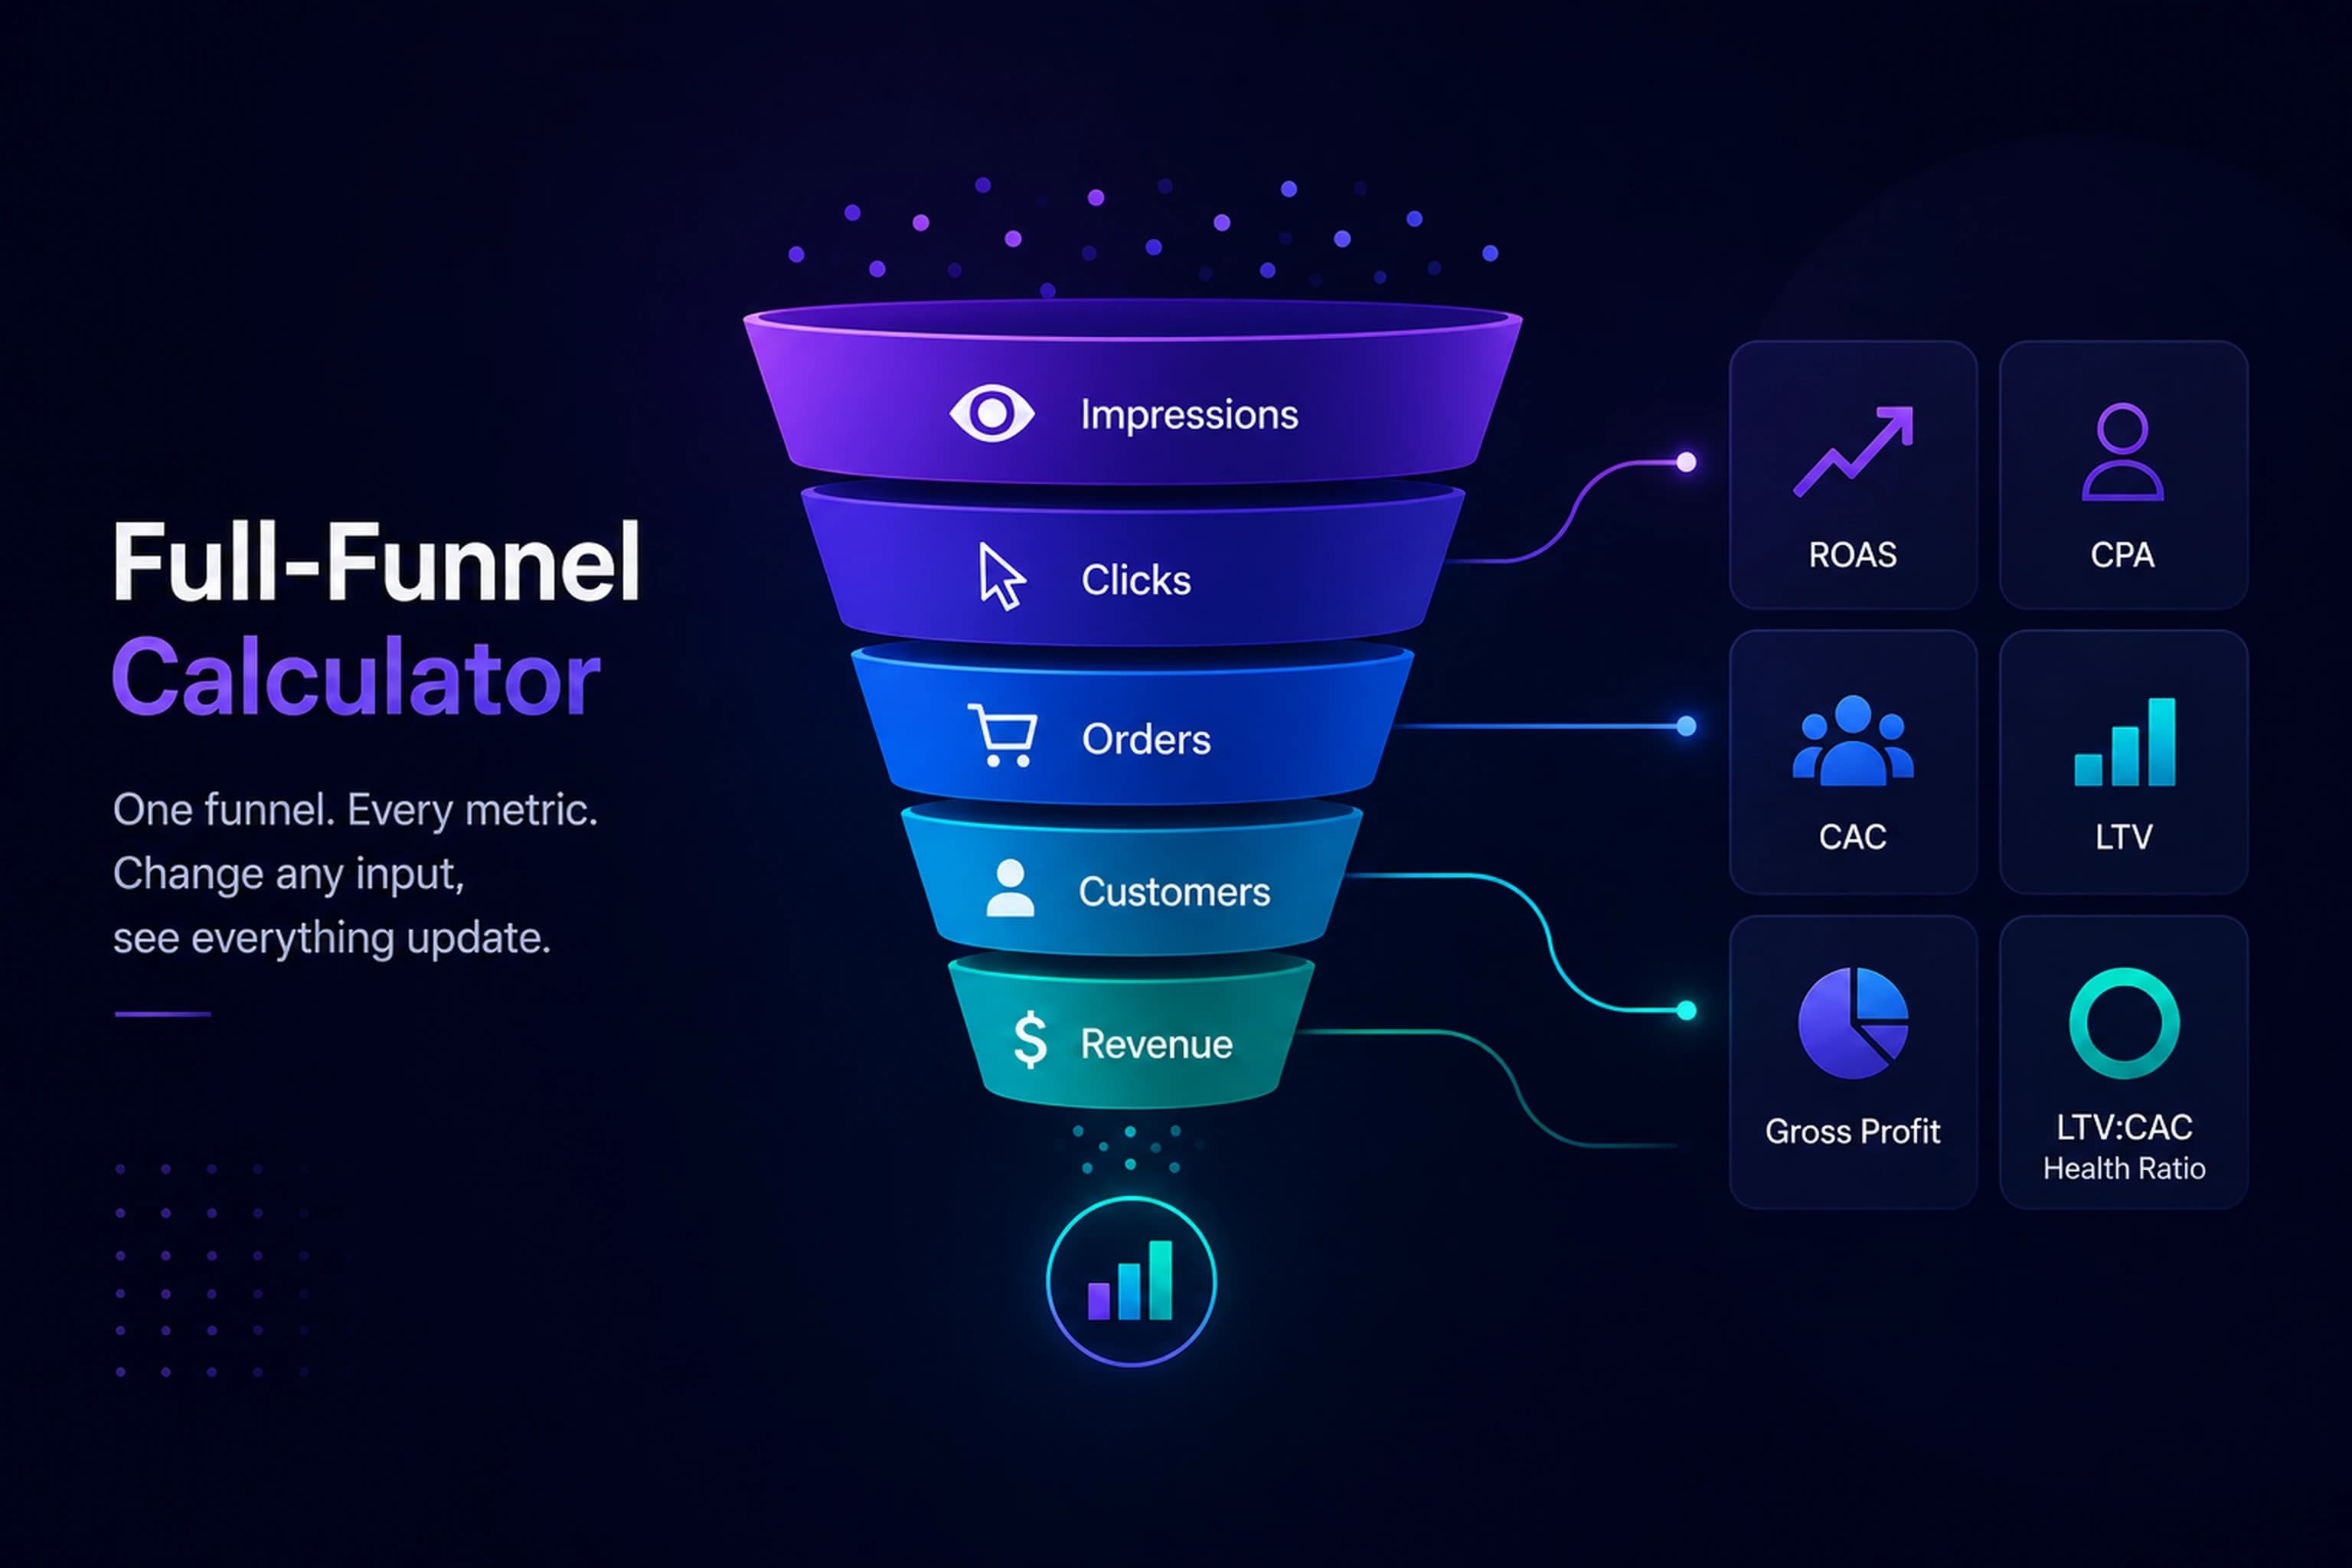
Model your entire paid-media funnel — impressions, CPM, CTR, CVR, and AOV — and instantly see ROAS, CPA, CAC, and LTV. Change any input to watch every downstream metric update, and gauge unit economics with an LTV:CAC health ratio.
ROAS Calculator
Calculate and analyze your return on ad spend (ROAS) to optimize campaign performance. Get data-driven insights on advertising efficiency, revenue attribution, and budget allocation to maximize marketing ROI.

CPA Calculator
Free CPA calculator: realized cost per acquisition from spend and conversions, funnel CPA from CPC or CPM × CTR × CVR, break-even CPA from margin, target CAC from LTV, and target CPA from ROAS — with cited 2026 lead-CPL and ecommerce-purchase bands. CSV export. No sign-up.
Related Analyzers
Paid Social Benchmarks
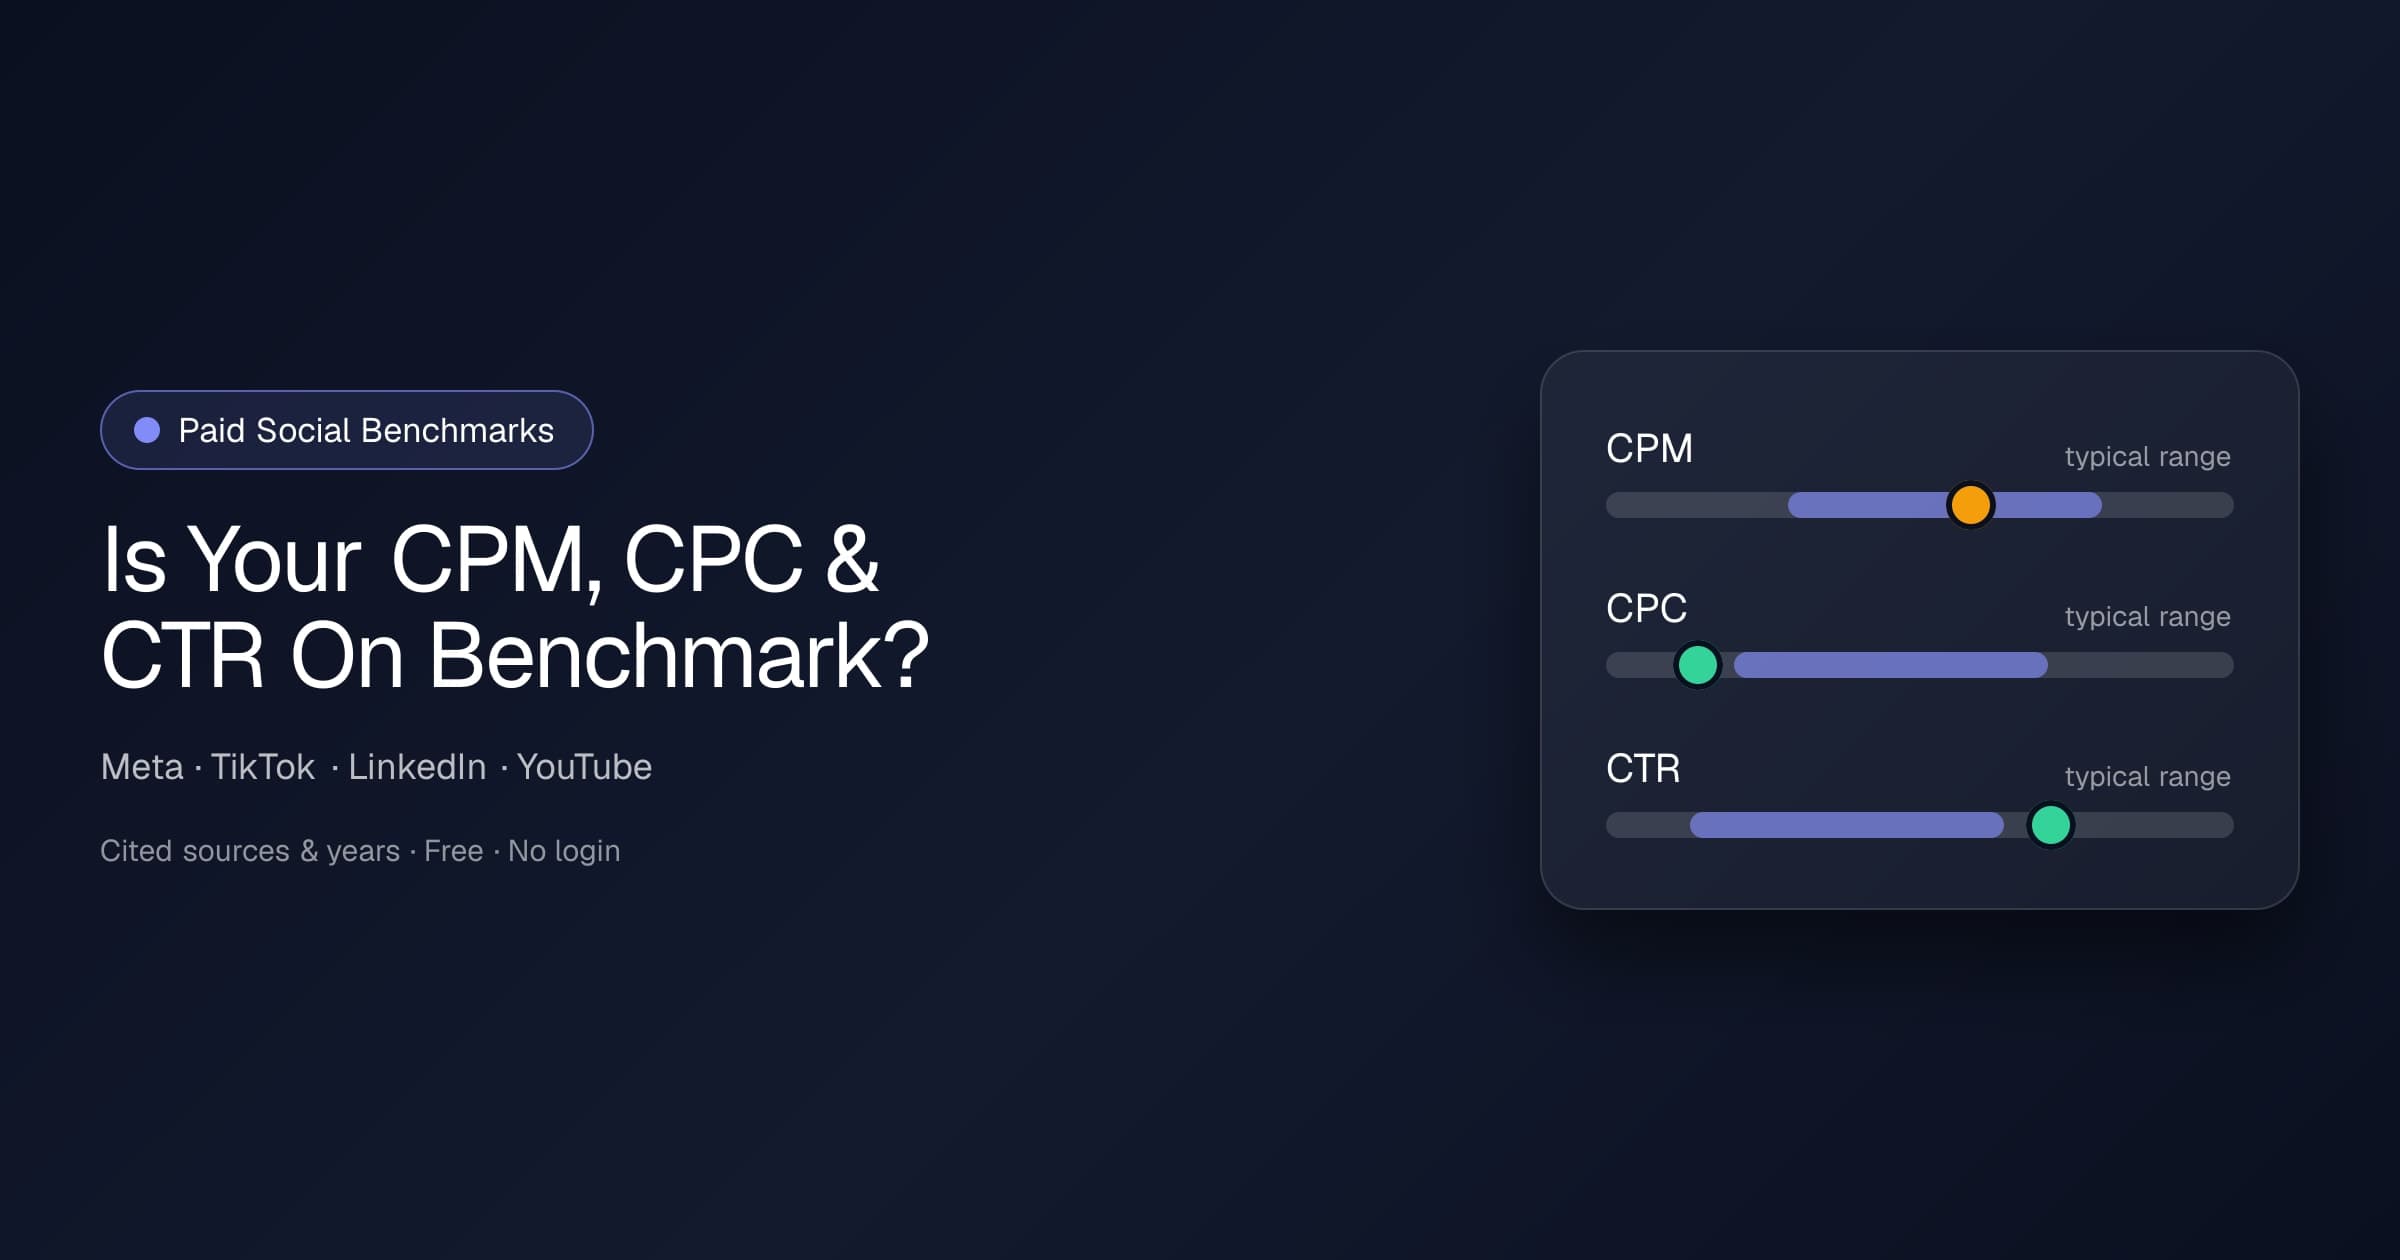
Enter your CPM, CPC, or CTR and see how it compares to current published benchmarks for Meta, TikTok, LinkedIn, and YouTube — segmented by campaign objective where the source splits them. Free, no login, every figure cited with source and year.
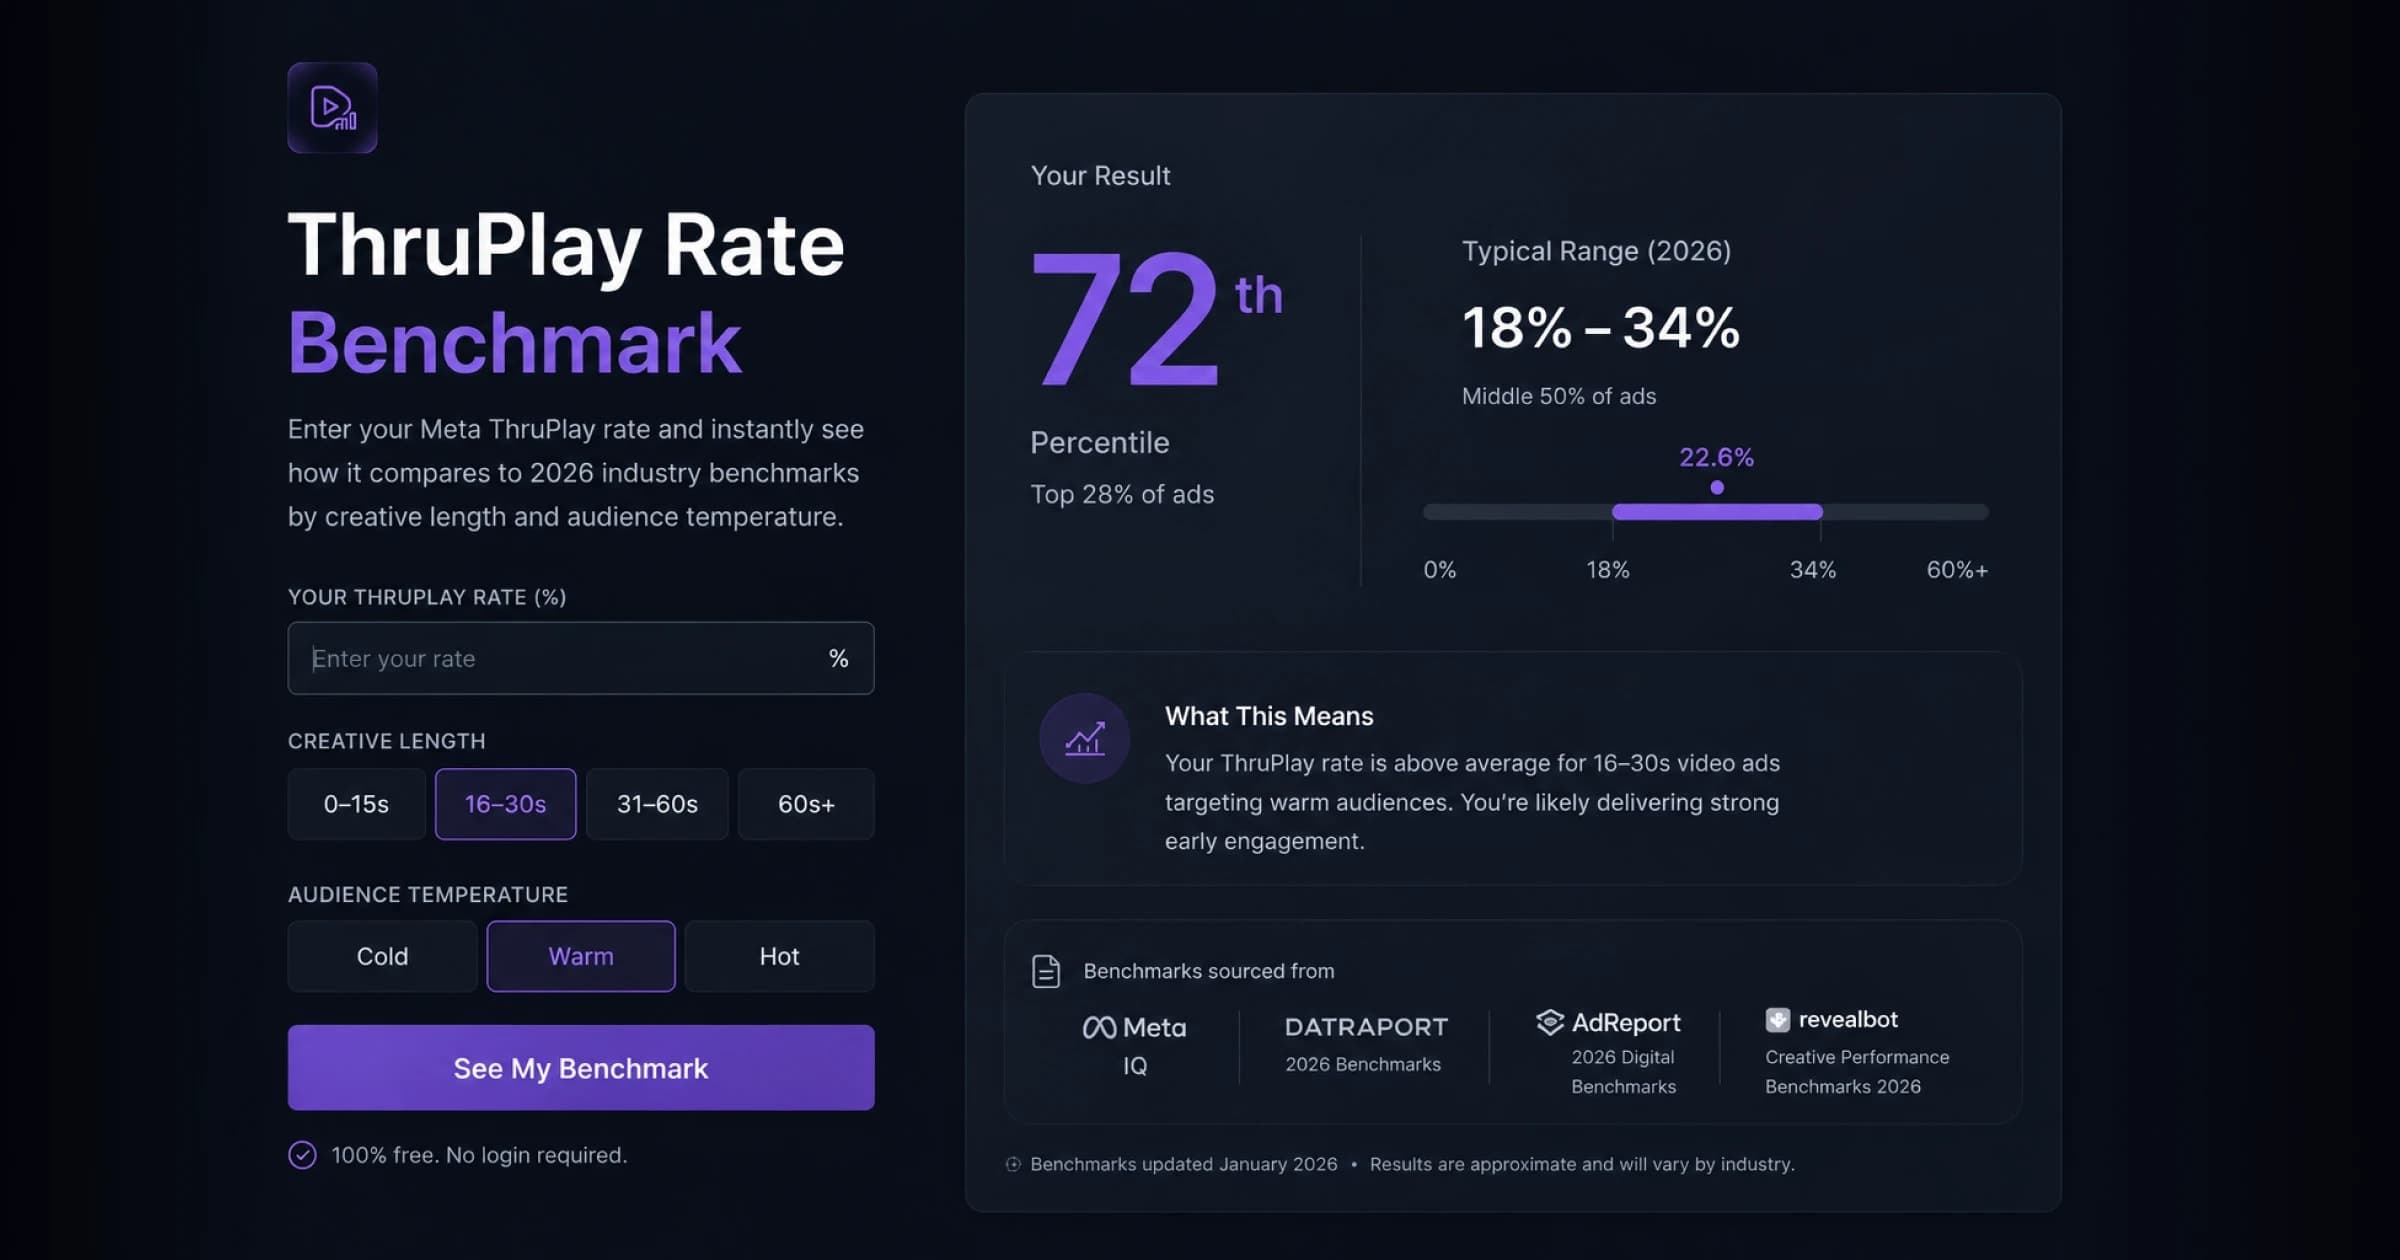
ThruPlay Rate Benchmark
Enter your Meta ThruPlay rate and instantly see how it compares to 2026 industry benchmarks by creative length and audience temperature. Free, no login — see where you land vs the cited typical range, with sources, and what your number means for creative performance.
Related Terms
Return on Ad Spend
Return on Ad Spend (ROAS) is a marketing performance metric that measures the revenue generated per dollar of advertising spend. Unlike ROI which considers all business costs, ROAS specifically evaluates advertising efficiency by comparing directly attributable revenue to ad spend. This metric is crucial for optimizing campaign performance, budget allocation, and overall marketing strategy.
Marketing Efficiency Ratio
Marketing Efficiency Ratio measures the overall effectiveness of marketing spend by comparing total revenue to total marketing costs. It provides a holistic view of marketing performance across all channels and customer types, including both direct and indirect revenue attribution. Also known as 'blended MER' since it considers all revenue rather than just attributed revenue.
Direct-to-Consumer
Direct-to-Consumer (DTC) is a business and marketing model where companies sell products directly to end consumers, bypassing traditional retail intermediaries. This approach enables brands to own the customer relationship, control the shopping experience, and gather first-party data while typically offering better value through reduced distribution costs.
