Guide
Benchmarks & how to read your result
How to read and act on your result — research-backed context with linked sources for every benchmark cited.
Break-even ROAS formula
Break-even ROAS = 1 ÷ gross profit margin (as a decimal).
At a 40% margin, break-even ROAS = 1 ÷ 0.40 = 2.5×, so every $1 of ad spend must return $2.50 in revenue to break even.
Profit-target ROAS = 1 ÷ (gross margin − target net margin). This is the ROAS that leaves your desired net margin after both cost of goods and ad spend.
Worked examples (three margins)
25%
- Break-even ROAS
- 4.0×
- Target ROAS (10% net margin goal)
- 6.67×
40%
- Break-even ROAS
- 2.5×
- Target ROAS (10% net margin goal)
- 3.33×
60%
- Break-even ROAS
- 1.67×
- Target ROAS (10% net margin goal)
- 2.0×
| Gross margin | Break-even ROAS | Target ROAS (10% net margin goal) |
|---|---|---|
| 25% | 4.0× | 6.67× |
| 40% | 2.5× | 3.33× |
| 60% | 1.67× | 2.0× |
Example at 40% margin and $50,000 ad spend: you need $125,000 in attributed revenue to break even, and $166,700 to hit a 10% net margin after COGS and ads. A campaign reporting 3.0× ROAS looks healthy on the platform but is only marginally profitable at this margin.
Benchmarks for target ROAS by business type
DTC eCommerce (35–45% margin)
- Typical break-even ROAS
- 2.2× – 2.9×
- Notes
- EcomHint 2025 avg platform ROAS ~2.2× on Meta prospecting
Supplements / beauty (50–70% margin)
- Typical break-even ROAS
- 1.4× – 2.0×
- Notes
- High margin lowers the floor
General retail (25–35% margin)
- Typical break-even ROAS
- 2.9× – 4.0×
- Notes
- Thin margin needs higher ROAS to profit
B2B SaaS (60–80% gross margin)
- Typical break-even ROAS
- 1.25× – 1.67×
- Notes
- LTV often justifies lower first-order ROAS
| Business type | Typical break-even ROAS | Notes |
|---|---|---|
| DTC eCommerce (35–45% margin) | 2.2× – 2.9× | EcomHint 2025 avg platform ROAS ~2.2× on Meta prospecting |
| Supplements / beauty (50–70% margin) | 1.4× – 2.0× | High margin lowers the floor |
| General retail (25–35% margin) | 2.9× – 4.0× | Thin margin needs higher ROAS to profit |
| B2B SaaS (60–80% gross margin) | 1.25× – 1.67× | LTV often justifies lower first-order ROAS |
Common mistakes
- Setting target ROAS from competitor benchmarks instead of margin. A 3.0× industry average is meaningless if your break-even is 4.0×.
- Using the same target for prospecting and retargeting. Retargeting converts cheaper; a single blended target starves prospecting or overpays for retargeting.
- Raising target ROAS to "fix" unprofitability when margin is the problem. If COGS rose, recompute break-even — don't chase a higher ROAS on broken unit economics.
- Ignoring MER while per-channel target ROAS looks fine. Attribution overlap can make every channel hit target while blended efficiency drops.
- Adding a 2× buffer above break-even. A modest 10–20% buffer preserves reach; an aggressive buffer caps volume and growth.
How to set Target ROAS in Google Ads
- Compute break-even ROAS from your gross margin using the formula above.
- Add a 10–20% buffer for prospecting volume (not a 2× buffer — that starves reach).
- Enter the result as tROAS in campaign bid strategy after you have 30+ conversions per month (Google needs conversion volume to optimize).
- Recompute when COGS, shipping, platform fees, or return rates change.
- Split prospecting and retargeting campaigns so each can use a margin-appropriate target.
How to improve your target ROAS floor
- Raise gross margin (pricing, bundles, reduce COGS) — directly lowers break-even ROAS.
- Improve conversion rate on landing pages — same margin, more revenue per click.
- Increase average order value — revenue per conversion rises without more ad spend.
- Focus on high-intent queries — better conversion efficiency lowers the ROAS you need.
- Use MER alongside tROAS — confirm blended efficiency when scaling.
When to use this vs the umbrella ROAS calculator
- This page: you know your margin and need a bid-strategy floor or profit-target ROAS.
- ROAS Calculator: you have revenue and spend and need realized ROAS compared to industry benchmarks.
Methodology & sources
Break-even ROAS is derived from margin math (1 ÷ gross margin). Platform ROAS ranges are prospecting benchmarks — retargeting typically runs 30–60% higher. Profit-target ROAS uses 1 ÷ (gross margin − target net margin).
Meta prospecting ROAS averages by vertical
FirstPageSage Marketing ROI Report
B2B and retail margin-adjusted ROAS context
LogicLibrary break-even ROAS methodology
Formula reference for bid-strategy floors
Target ROAS Calculator
Free target ROAS calculator: work out the break-even and profit-target return on ad spend your margins demand before you set bids or scale a campaign. Enter your gross margin to get the break-even and target ROAS, plus spend, conversion rate, and order value to see how your realized ROAS compares.
Free Calculator
No sign up required. Use this calculator as much as you need.
Stop calculating by hand
Want AI to track this across every creative variant — and tie it back to ROAS automatically? That’s what AdSights does.
Request early accessRelated Calculators

ROAS Calculator
Calculate and analyze your return on ad spend (ROAS) to optimize campaign performance. Get data-driven insights on advertising efficiency, revenue attribution, and budget allocation to maximize marketing ROI.
Full-Funnel Calculator
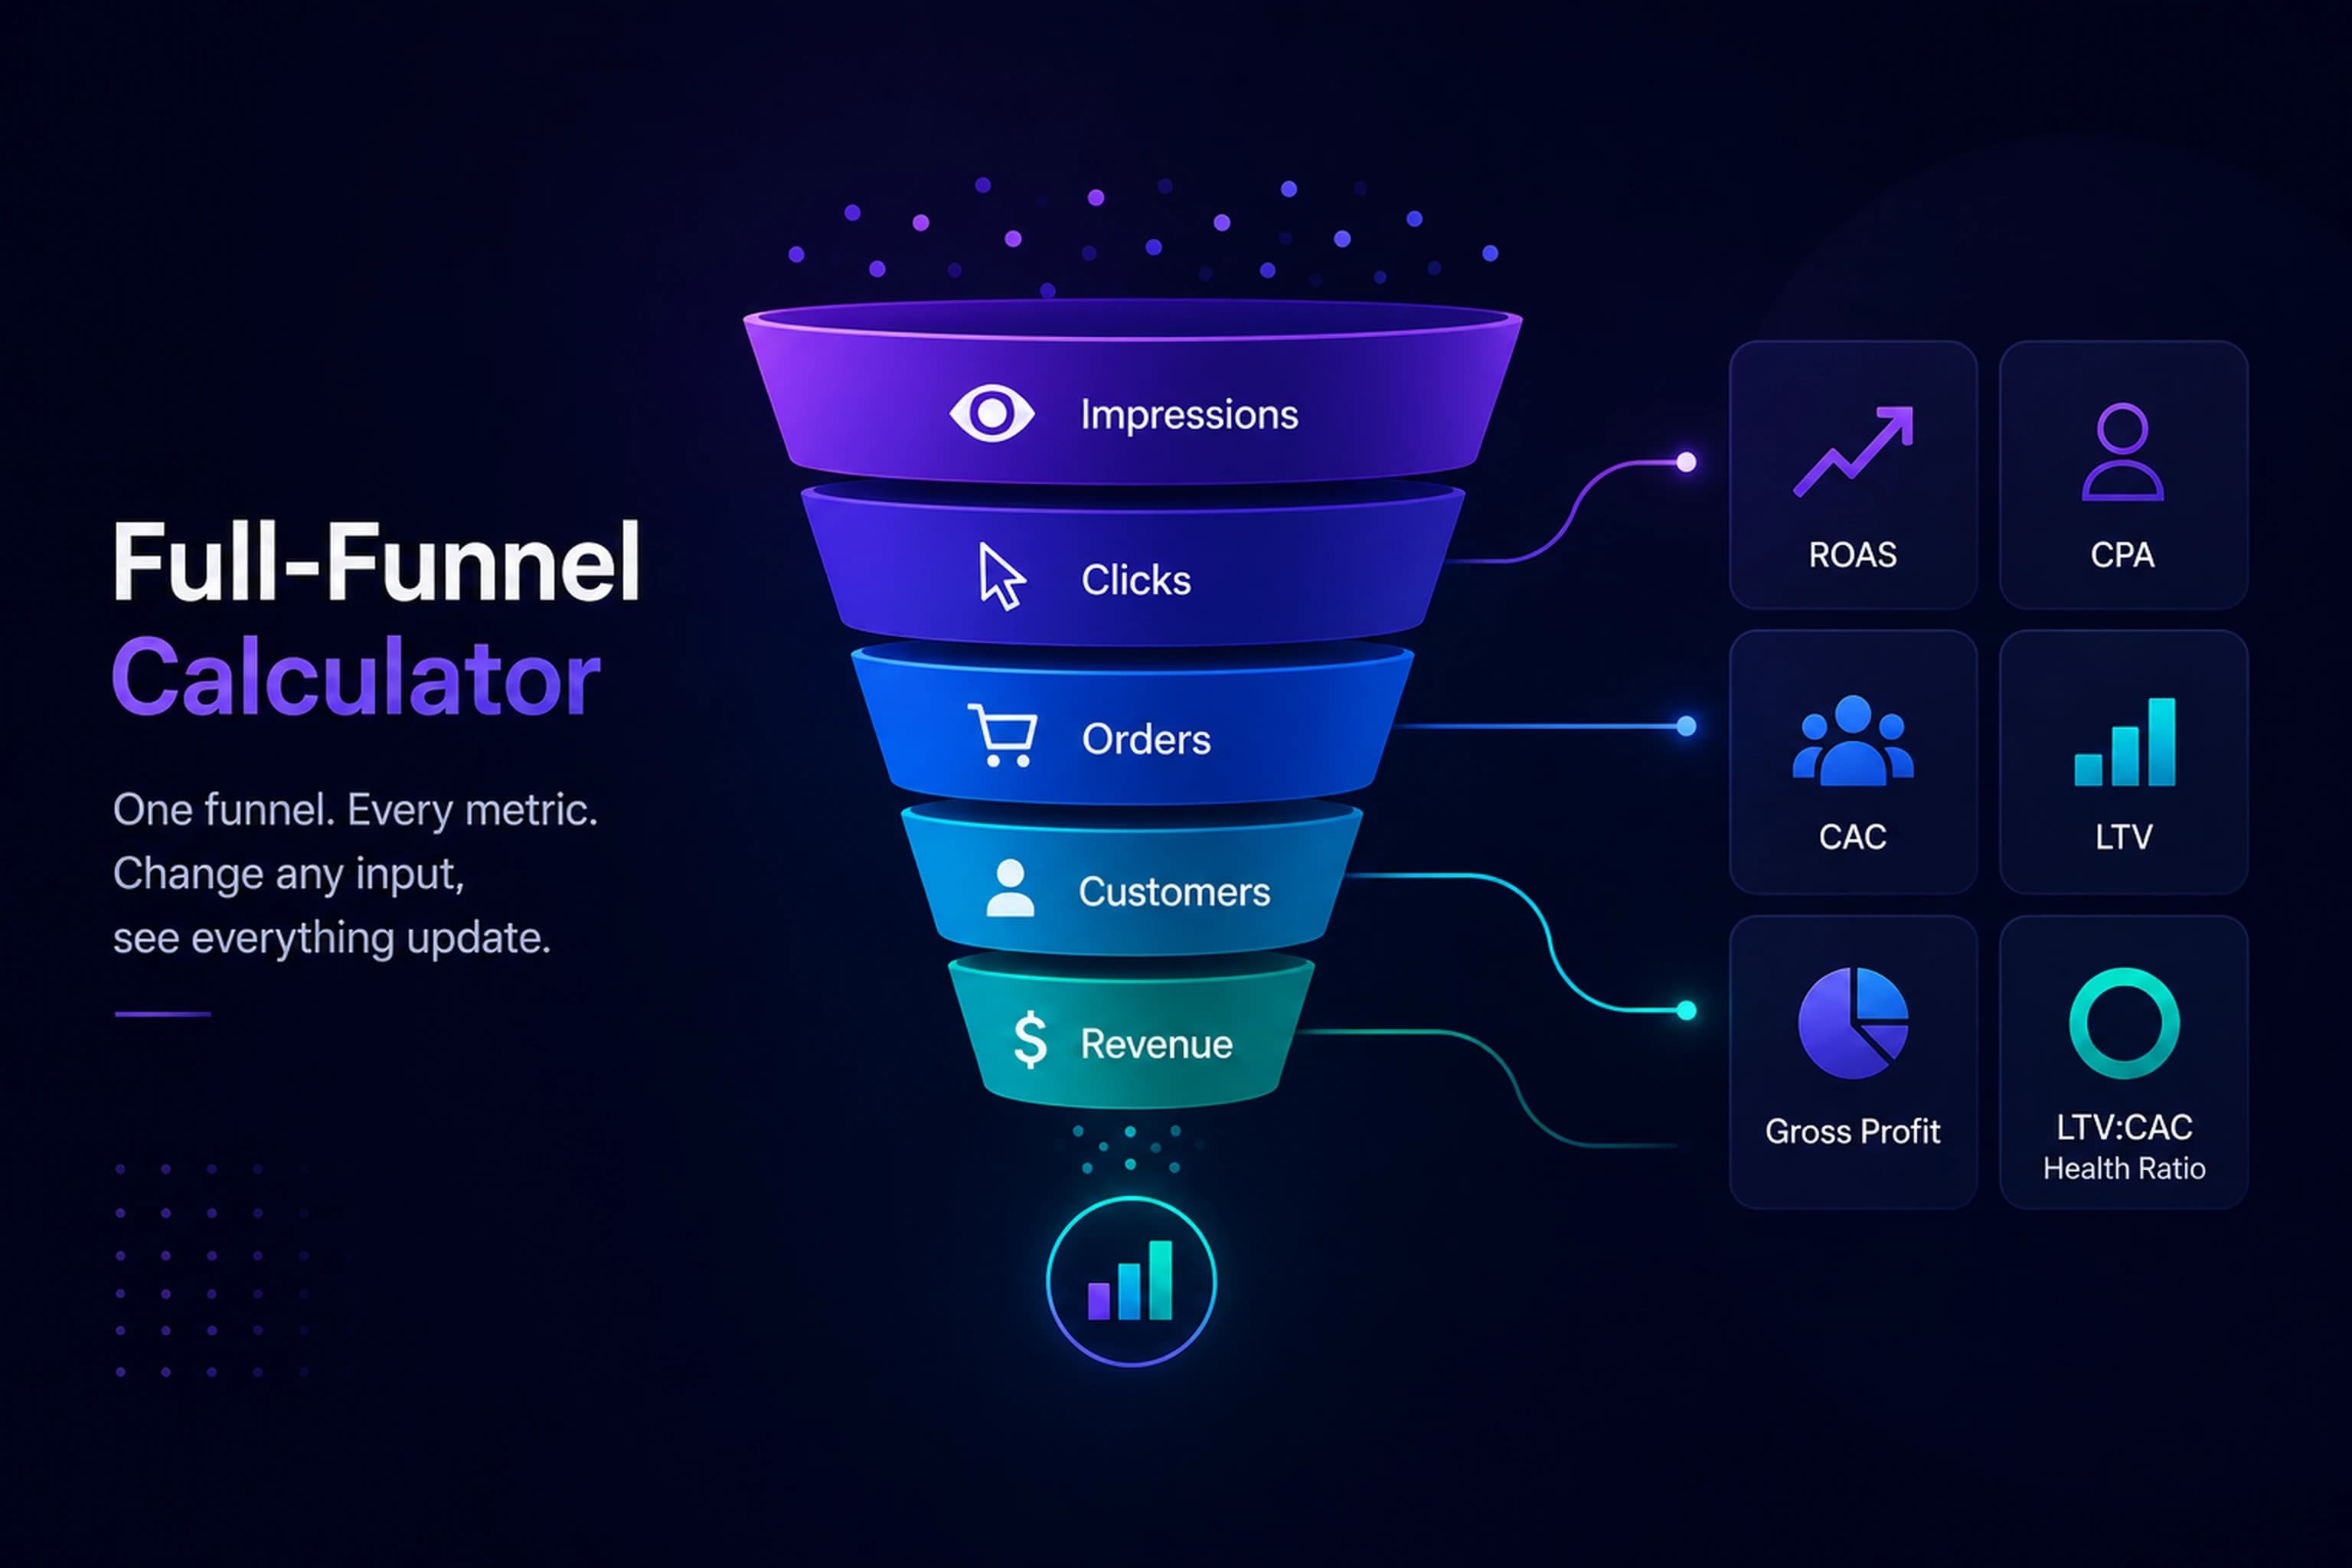
Model your entire paid-media funnel — impressions, CPM, CTR, CVR, and AOV — and instantly see ROAS, CPA, CAC, and LTV. Change any input to watch every downstream metric update, and gauge unit economics with an LTV:CAC health ratio.

CPA Calculator
Free CPA calculator: realized cost per acquisition from spend and conversions, funnel CPA from CPC or CPM × CTR × CVR, break-even CPA from margin, target CAC from LTV, and target CPA from ROAS — with cited 2026 lead-CPL and ecommerce-purchase bands. CSV export. No sign-up.
Related Analyzers
Paid Social Benchmarks
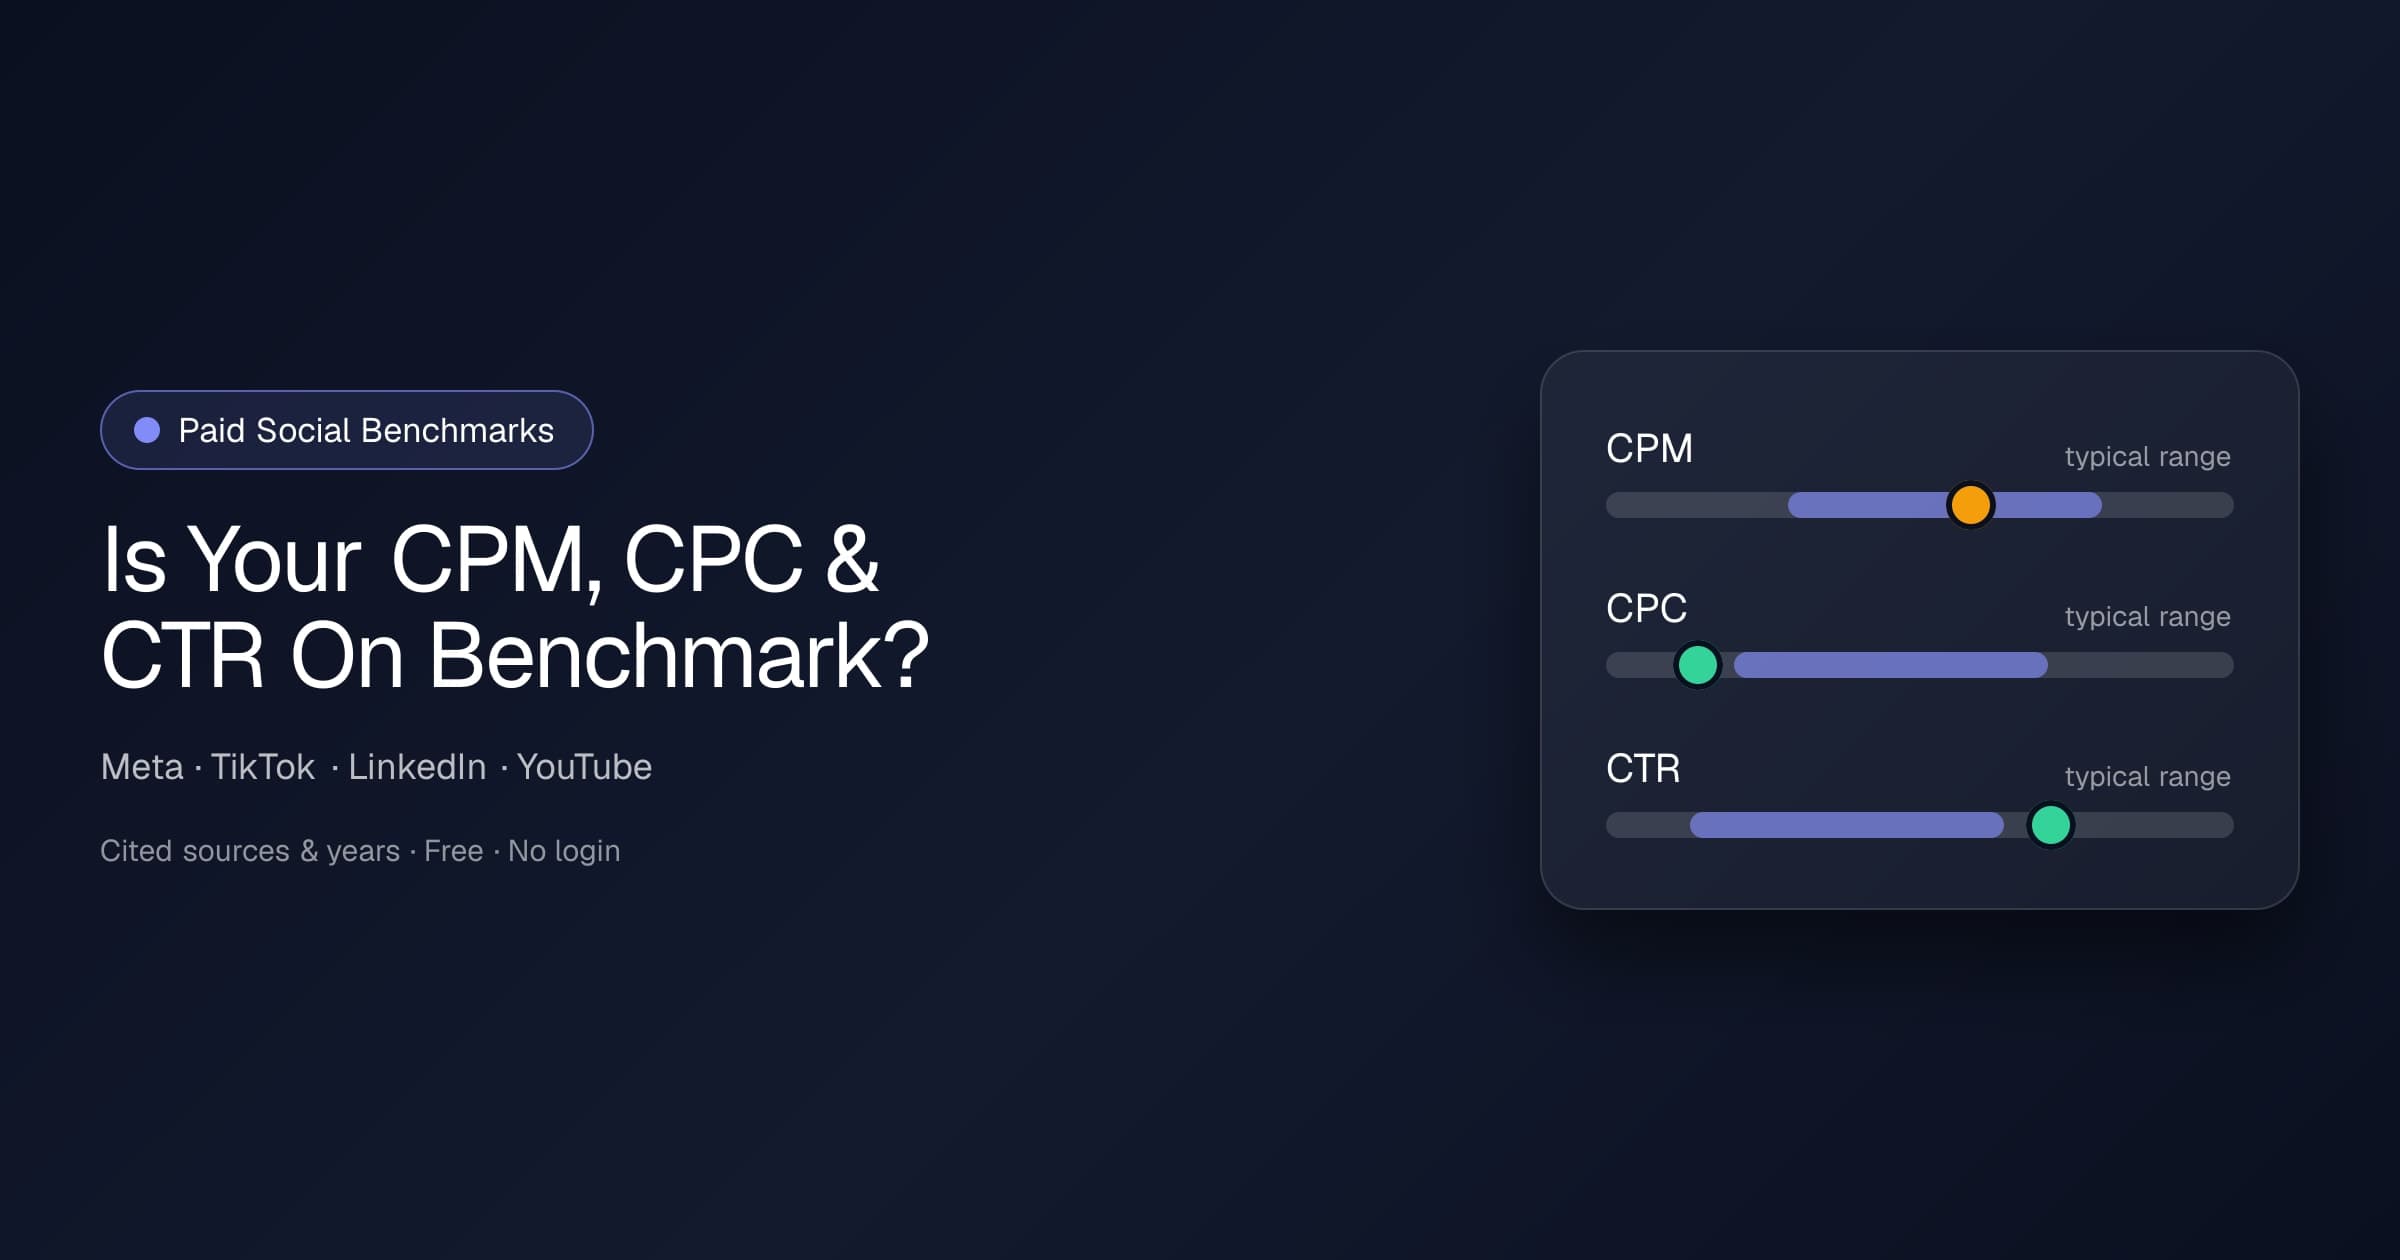
Enter your CPM, CPC, or CTR and see how it compares to current published benchmarks for Meta, TikTok, LinkedIn, and YouTube — segmented by campaign objective where the source splits them. Free, no login, every figure cited with source and year.

ThruPlay Rate Benchmark
Enter your Meta ThruPlay rate and instantly see how it compares to 2026 industry benchmarks by creative length and audience temperature. Free, no login — see where you land vs the cited typical range, with sources, and what your number means for creative performance.
Related Terms
Return on Ad Spend
Return on Ad Spend (ROAS) is a marketing performance metric that measures the revenue generated per dollar of advertising spend. Unlike ROI which considers all business costs, ROAS specifically evaluates advertising efficiency by comparing directly attributable revenue to ad spend. This metric is crucial for optimizing campaign performance, budget allocation, and overall marketing strategy.
Conversion Rate
Conversion rate measures the percentage of users who complete a defined conversion action relative to the total number who had the opportunity to convert. This metric evaluates the effectiveness of marketing efforts, user experience, and overall funnel efficiency in driving desired outcomes. Conversion actions can range from purchases and form submissions to content downloads and subscription signups.
Exponential Moving Average
An exponential moving average is a type of moving average that places greater weight on more recent data points, making it more responsive to recent changes while still smoothing out noise. Each period's EMA blends the newest value with the previous EMA, so older data fades exponentially rather than dropping out abruptly. This is particularly useful for metrics that require faster reaction to changes, such as fatigue inflections or post-launch drops.
