Guide
Benchmarks & how to read your result
How to read and act on your result — research-backed context with linked sources for every benchmark cited.
ROAS vs ad ROI
ROAS is revenue per dollar of ad spend (revenue ÷ ad spend). ROI is profit per dollar of ad spend, expressed as a percentage: ROI = net profit ÷ ad spend × 100, where net profit subtracts cost of goods (via your gross margin) and the ad spend itself from revenue — not just the ad spend. A campaign can show a healthy 4.0 ROAS and still be a poor ROI once product costs are subtracted.
ROAS vs ad ROI — comparison table
ROAS
- Formula
- Revenue ÷ Ad Spend
- Includes COGS?
- No
- Best for
- Media buyers, daily optimization
Ad ROI
- Formula
- (Revenue − Ad Spend − COGS) ÷ Ad Spend × 100%
- Includes COGS?
- Yes
- Best for
- CFO, board, budget approval
MER
- Formula
- Total Revenue ÷ Total Marketing Spend
- Includes COGS?
- No (blended)
- Best for
- Strategic budget decisions
| Metric | Formula | Includes COGS? | Best for |
|---|---|---|---|
| ROAS | Revenue ÷ Ad Spend | No | Media buyers, daily optimization |
| Ad ROI | (Revenue − Ad Spend − COGS) ÷ Ad Spend × 100% | Yes | CFO, board, budget approval |
| MER | Total Revenue ÷ Total Marketing Spend | No (blended) | Strategic budget decisions |
How to Calculate Ad Spend ROI
Enter your gross profit margin alongside spend, conversion rate, and order value. The calculator derives revenue and ROAS, multiplies revenue by your margin to get gross profit, subtracts ad spend to get net profit, and divides that by ad spend for your Marketing ROI %. The displayed Net Profit accounts for cost of goods, so it matches the ROI rather than contradicting it.
Worked example: ROAS vs ROI
$10,000 ad spend → $40,000 revenue at 35% gross margin:
- ROAS = $40,000 ÷ $10,000 = 4.0× (looks strong)
- Gross profit = $40,000 × 35% = $14,000
- Net profit after ads = $14,000 − $10,000 = $4,000
- Ad ROI = $4,000 ÷ $10,000 × 100 = 40%
Same campaign at 25% margin: gross profit = $10,000, net profit = $0, ROI = 0% despite 4.0× ROAS. This is why finance asks for ROI, not ROAS.
Benchmarks: when is ad ROI "good"?
Below 0%
- Interpretation
- Losing money
- Typical Context
- Below break-even margin or overspending
0–20%
- Interpretation
- Thin profit
- Typical Context
- Room to optimize before scaling
20–50%
- Interpretation
- Healthy
- Typical Context
- Common scale zone for DTC prospecting
50%+
- Interpretation
- Strong
- Typical Context
- Verify incrementality — may be attribution-inflated
| Ad ROI % | Interpretation | Typical Context |
|---|---|---|
| Below 0% | Losing money | Below break-even margin or overspending |
| 0–20% | Thin profit | Room to optimize before scaling |
| 20–50% | Healthy | Common scale zone for DTC prospecting |
| 50%+ | Strong | Verify incrementality — may be attribution-inflated |
Pair with break-even ROAS from the Target ROAS Calculator for a complete picture.
When to report ROI vs ROAS to finance
- ROAS for media buyers optimizing bids, creatives, and audiences day to day.
- ROI for CFO, board, and annual budget reviews — profit language, not revenue language.
- MER when attribution is unreliable and you need blended program truth.
Common mistakes
- Presenting 4× ROAS to finance without margin context — they will ask about COGS.
- Treating ROAS and ROI as interchangeable in reporting — different audiences need different metrics.
- Ignoring returns/refunds in revenue — net revenue lowers both ROAS and ROI.
- Using platform-reported revenue without reconciling to Shopify/ERP gross sales.
- Scaling on ROAS while ROI compresses — often means rising CAC or falling margin.
How to use this calculator
- Enter gross profit margin (required for ROI — this is what separates this page from basic ROAS).
- Enter ad spend, CPC, conversion rate, and order value (or revenue directly).
- Read ROAS for channel optimization and Marketing ROI % for profitability.
- Compare ROI to your hurdle rate (often 20–40% for growth-stage brands).
- Cross-check with MER for blended efficiency.
How to improve ad ROI
- Raise gross margin (pricing, COGS reduction) — improves ROI at the same ROAS.
- Improve conversion rate — more revenue and gross profit per click.
- Lower CAC via creative testing and audience refinement.
- Cut spend on sub-break-even campaigns (negative ROI).
- Run incrementality tests — reported ROI may be 30–60% lower than attributed.
Methodology & sources
ROI benchmarks assume COGS is captured via gross margin input. Attribution-inflated ROAS can overstate ROI by 30–60% on duplicated conversions — cross-check with MER before board reporting.
FirstPageSage Marketing ROI Report
Industry ROI ranges by channel
WordStream & LocaliQ Benchmarks
ROAS baselines for ROI comparison
Common Thread Collective DTC Index
Incrementality and MER context for DTC
Ad Spend ROI Calculator
Free ad spend ROI calculator: turn advertising spend, the revenue it drives, and your gross margin into both ROAS and true marketing ROI. See return on ad spend and the COGS-aware, profit-based ROI behind it so you can defend ad budgets with the number finance actually asks for.
Free Calculator
No sign up required. Use this calculator as much as you need.
Stop calculating by hand
Want AI to track this across every creative variant — and tie it back to ROAS automatically? That’s what AdSights does.
Request early accessRelated Calculators

Incrementality Calculator
Measure the true impact of your marketing campaigns by calculating incrementality. Understand which portion of your conversions would have happened organically versus those directly caused by your marketing efforts.

CPA Calculator
Free CPA calculator: realized cost per acquisition from spend and conversions, funnel CPA from CPC or CPM × CTR × CVR, break-even CPA from margin, target CAC from LTV, and target CPA from ROAS — with cited 2026 lead-CPL and ecommerce-purchase bands. CSV export. No sign-up.

CPM Calculator
Calculate Cost Per Mille (CPM) and analyze advertising campaign performance with precision. Get comprehensive insights on media buying efficiency, budget optimization, and campaign ROI analysis.
Related Analyzers
Paid Social Benchmarks
Enter your CPM, CPC, or CTR and see how it compares to current published benchmarks for Meta, TikTok, LinkedIn, and YouTube — segmented by campaign objective where the source splits them. Free, no login, every figure cited with source and year.
ThruPlay Rate Benchmark
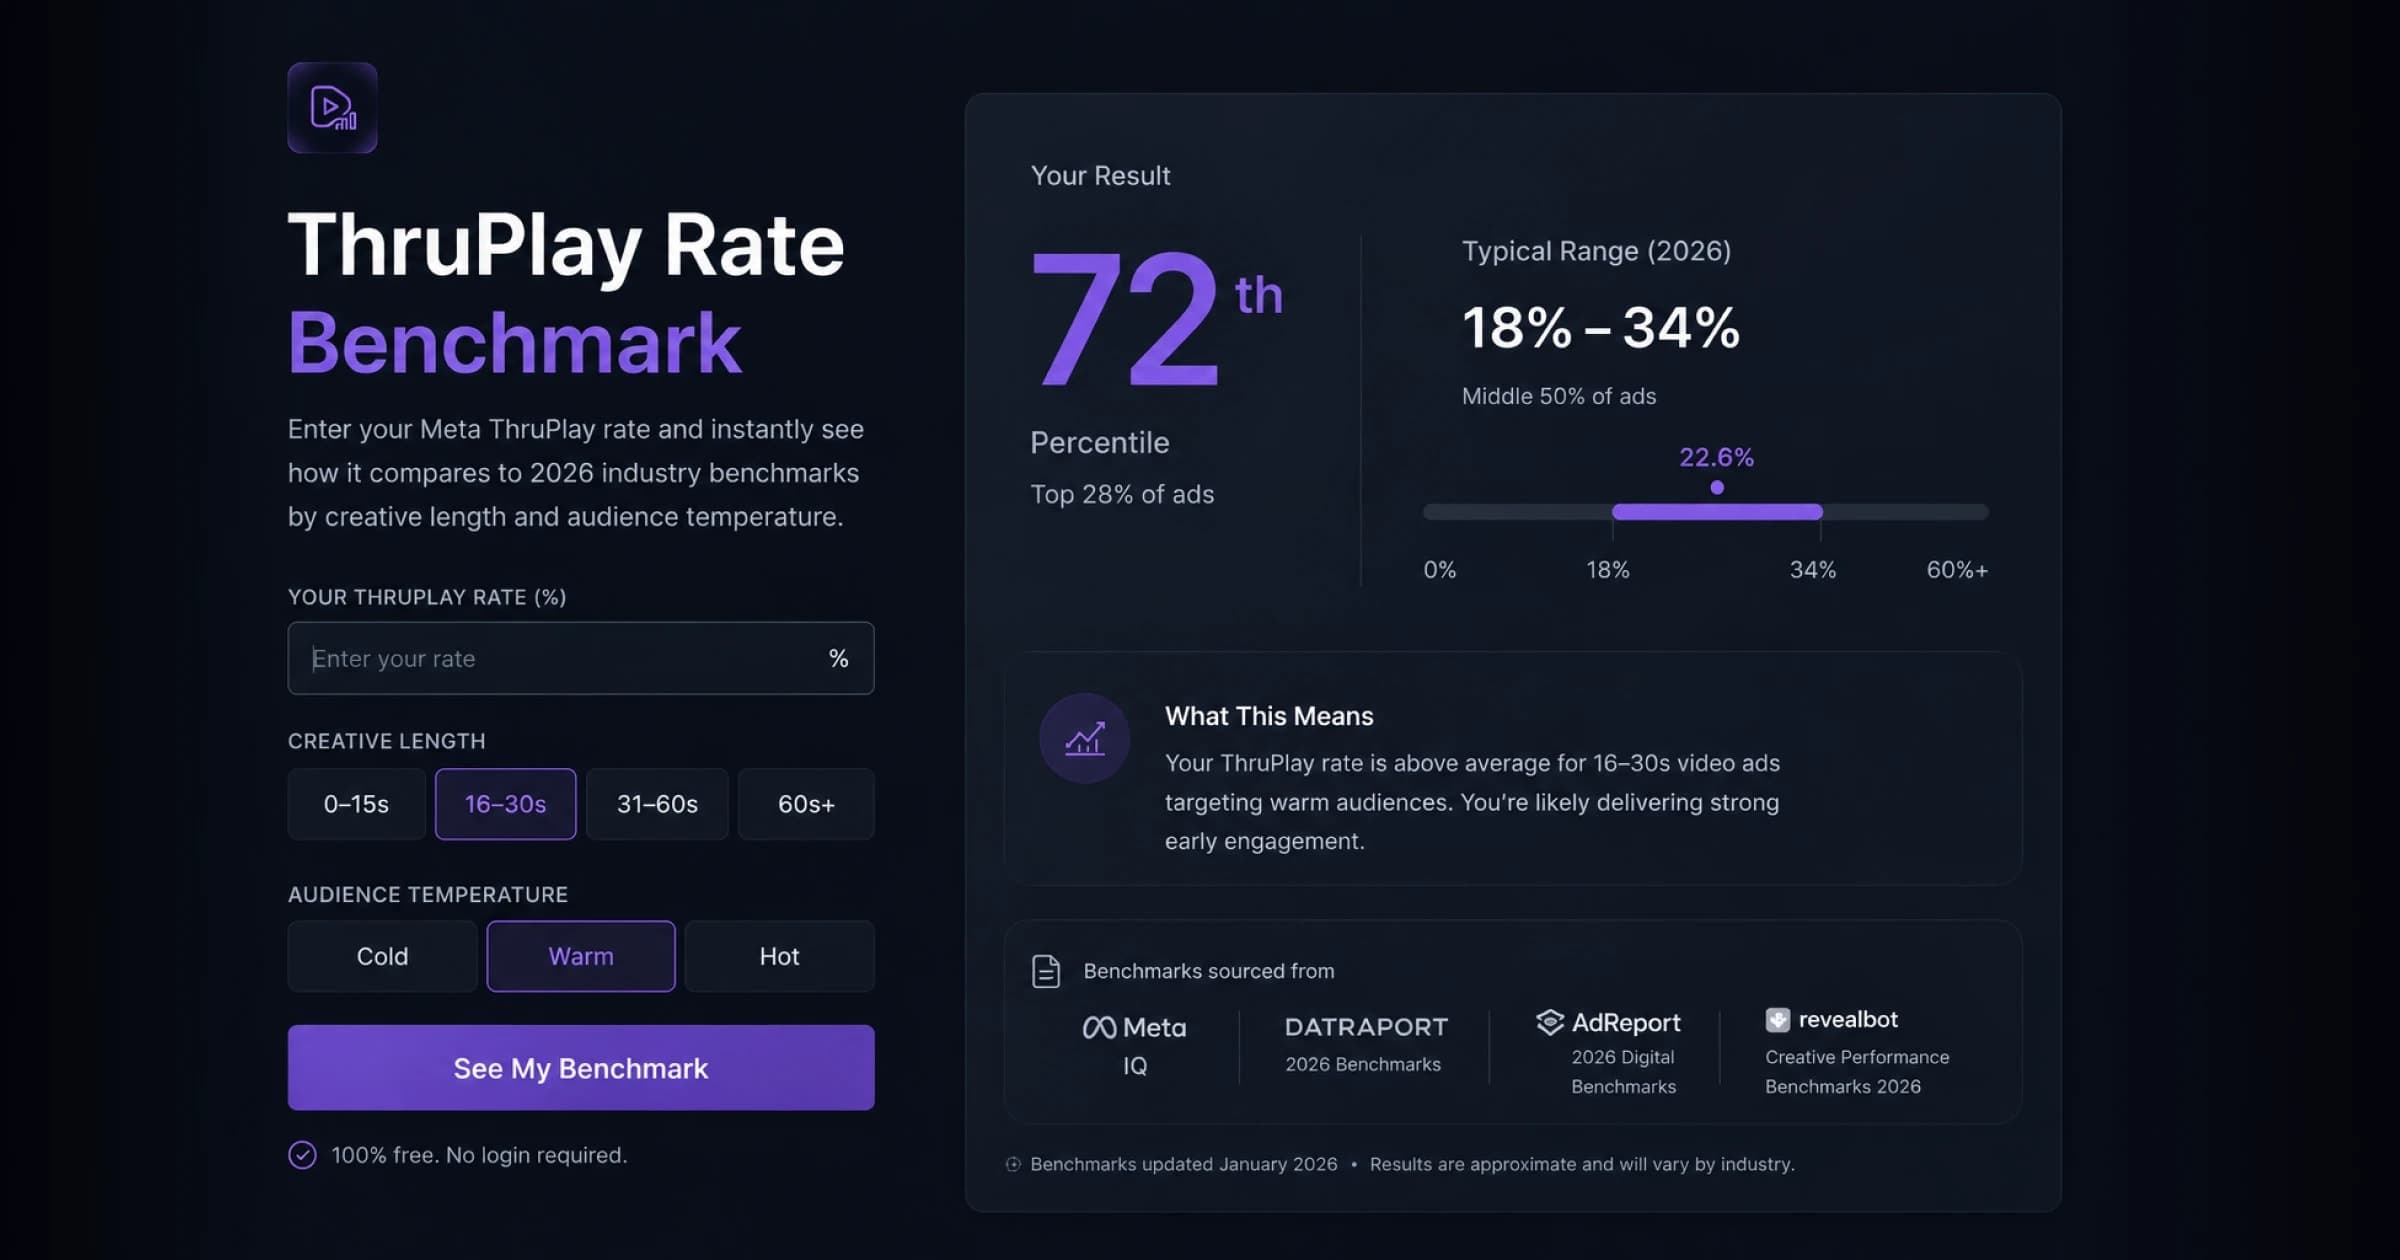
Enter your Meta ThruPlay rate and instantly see how it compares to 2026 industry benchmarks by creative length and audience temperature. Free, no login — see where you land vs the cited typical range, with sources, and what your number means for creative performance.
Related Terms
Return on Investment
Return on Investment measures the profitability of an investment by comparing the net profit (revenue minus all costs) to the total investment cost. In marketing, it considers all costs including media spend, creative production, technology, overhead, and operational expenses, making it a more comprehensive metric than ROAS which focuses specifically on ad spend.
Return on Ad Spend
Return on Ad Spend (ROAS) is a marketing performance metric that measures the revenue generated per dollar of advertising spend. Unlike ROI which considers all business costs, ROAS specifically evaluates advertising efficiency by comparing directly attributable revenue to ad spend. This metric is crucial for optimizing campaign performance, budget allocation, and overall marketing strategy.
Paid Media
Paid media encompasses all forms of advertising and promotional content where brands pay for placement, visibility, or engagement. This includes traditional advertising channels as well as digital platforms where payment is exchanged for audience reach, impressions, clicks, or other marketing objectives.
