How to Interpret ThruPlay Rate (and When It Misleads You)
Understand what ThruPlay rate measures on Meta, how it differs from VCR and hold rate, when it misleads you, and a diagnostic workflow for underperforming video ads — with pointers to the canonical benchmark resources.
Quick takeaway
ThruPlay counts plays to completion (under 15s) or to 15 seconds — not ad clicks — so always pair it with hold rate and thumbstop before diagnosing hook vs body performance.
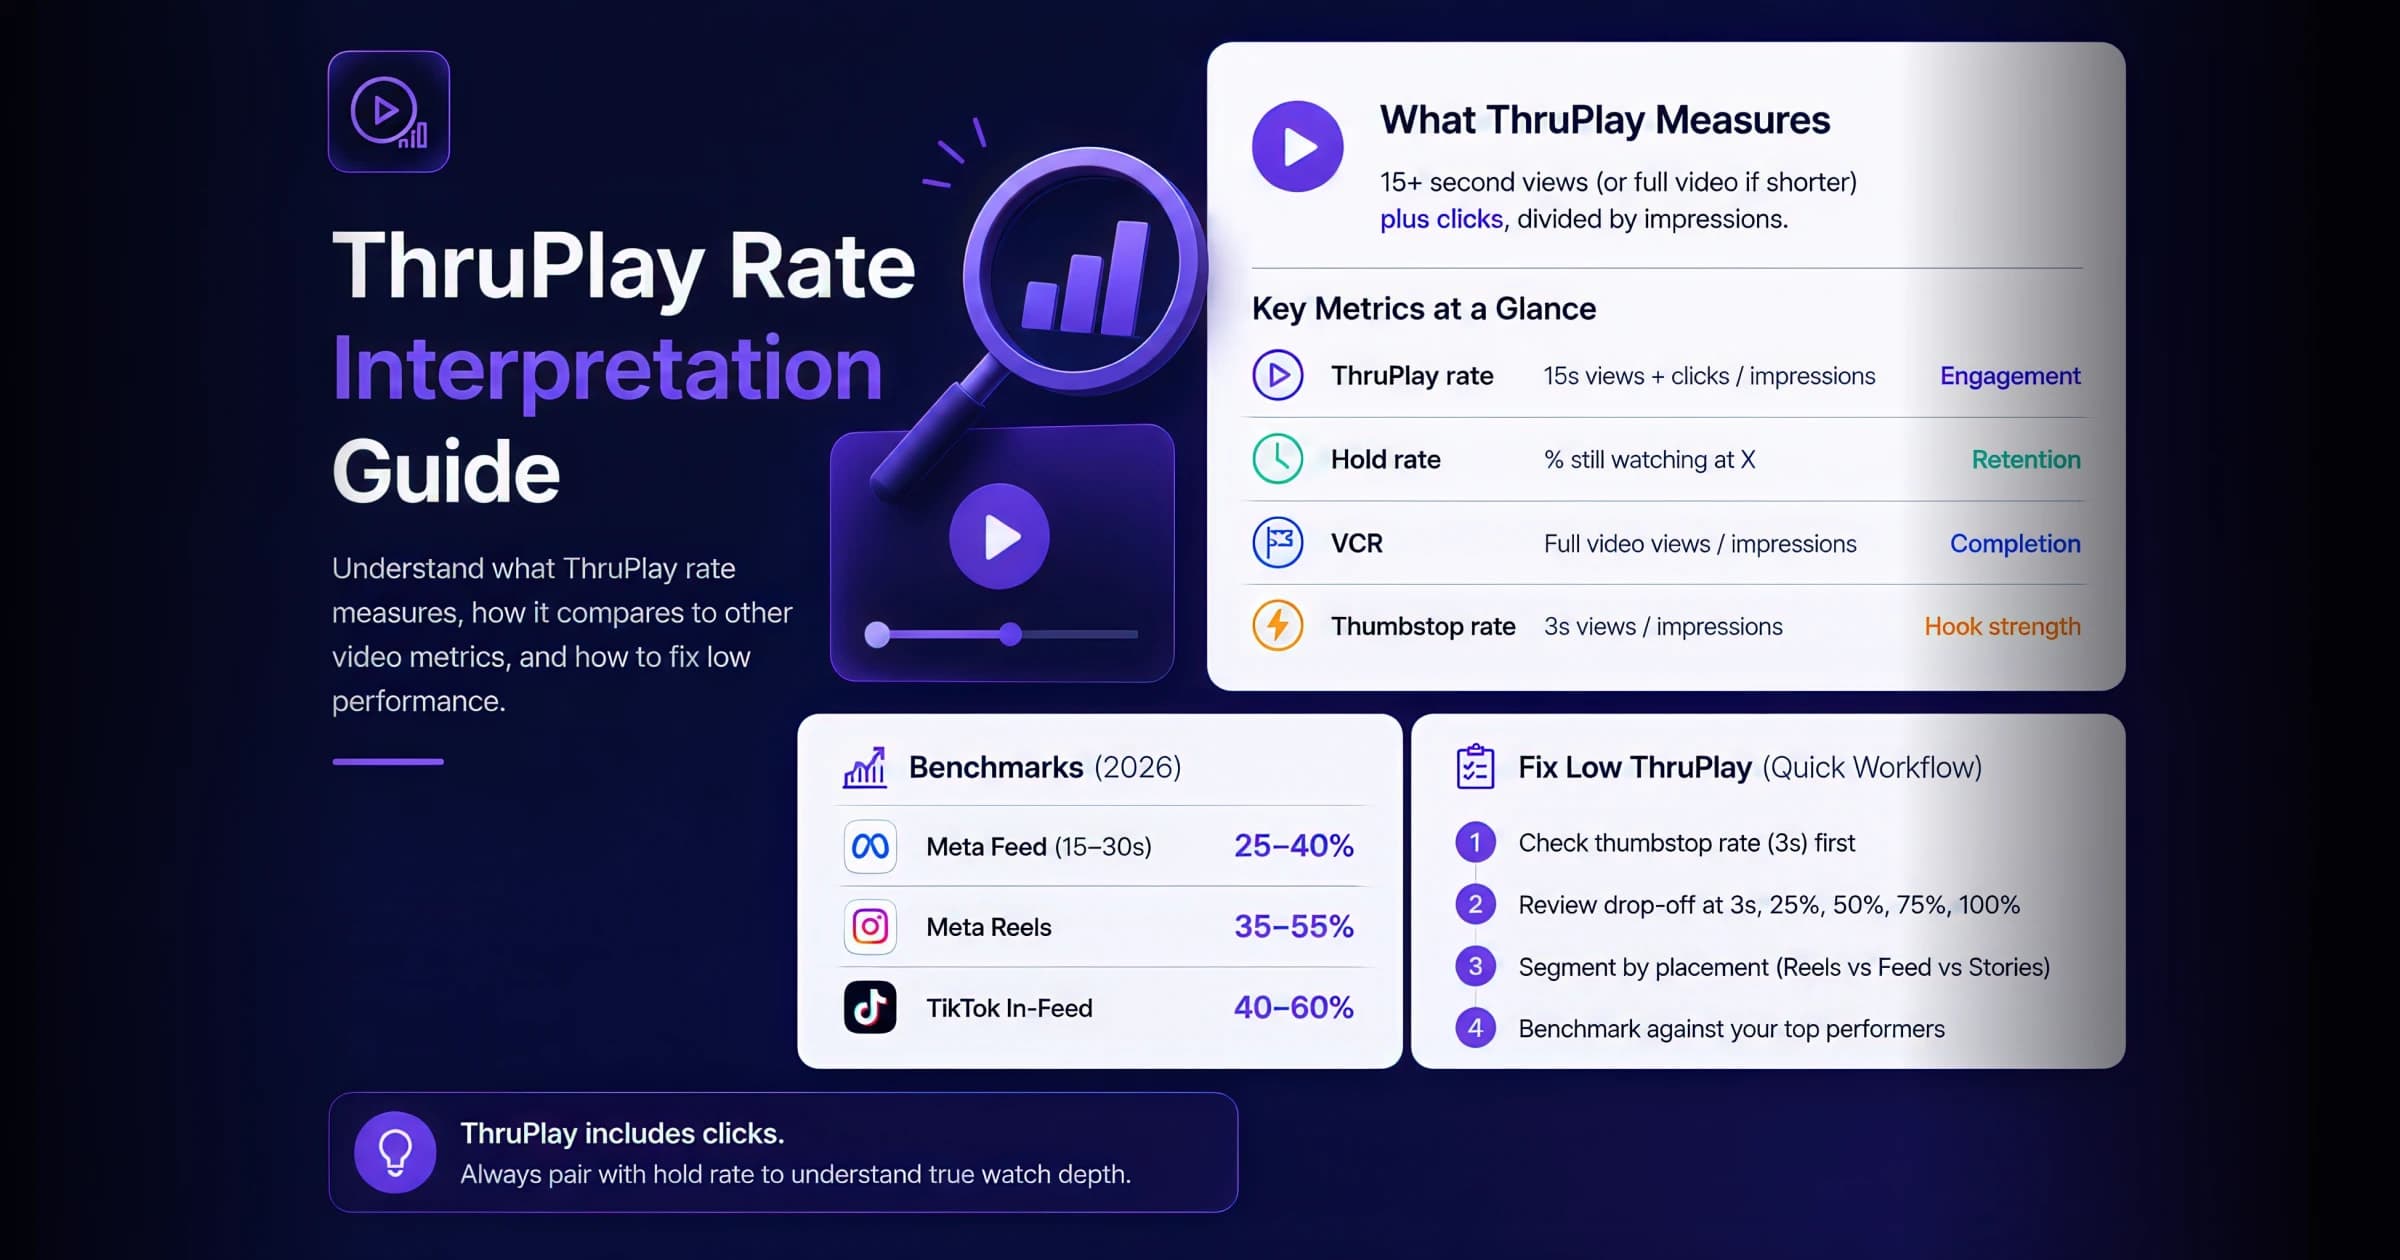
What ThruPlay Rate Actually Measures
ThruPlay is Meta's engagement-depth metric — not a proxy for conversions.
ThruPlay rate = ThruPlays ÷ Video Plays × 100
A ThruPlay fires when a viewer watches the video to completion (under 15s) or for 15+ seconds (longer videos). It does not count ad clicks — a common misconception. Because ThruPlay also counts sub-15-second completions, the rate can look healthy even when deeper retention is poor. Always pair it with hold rate (retention at 3s, 25%, 50%) to understand whether viewers are actually watching. (On Meta, autoplay keeps video plays ≈ impressions, so the band holds either way.)
| Metric | Definition | Best for |
|---|---|---|
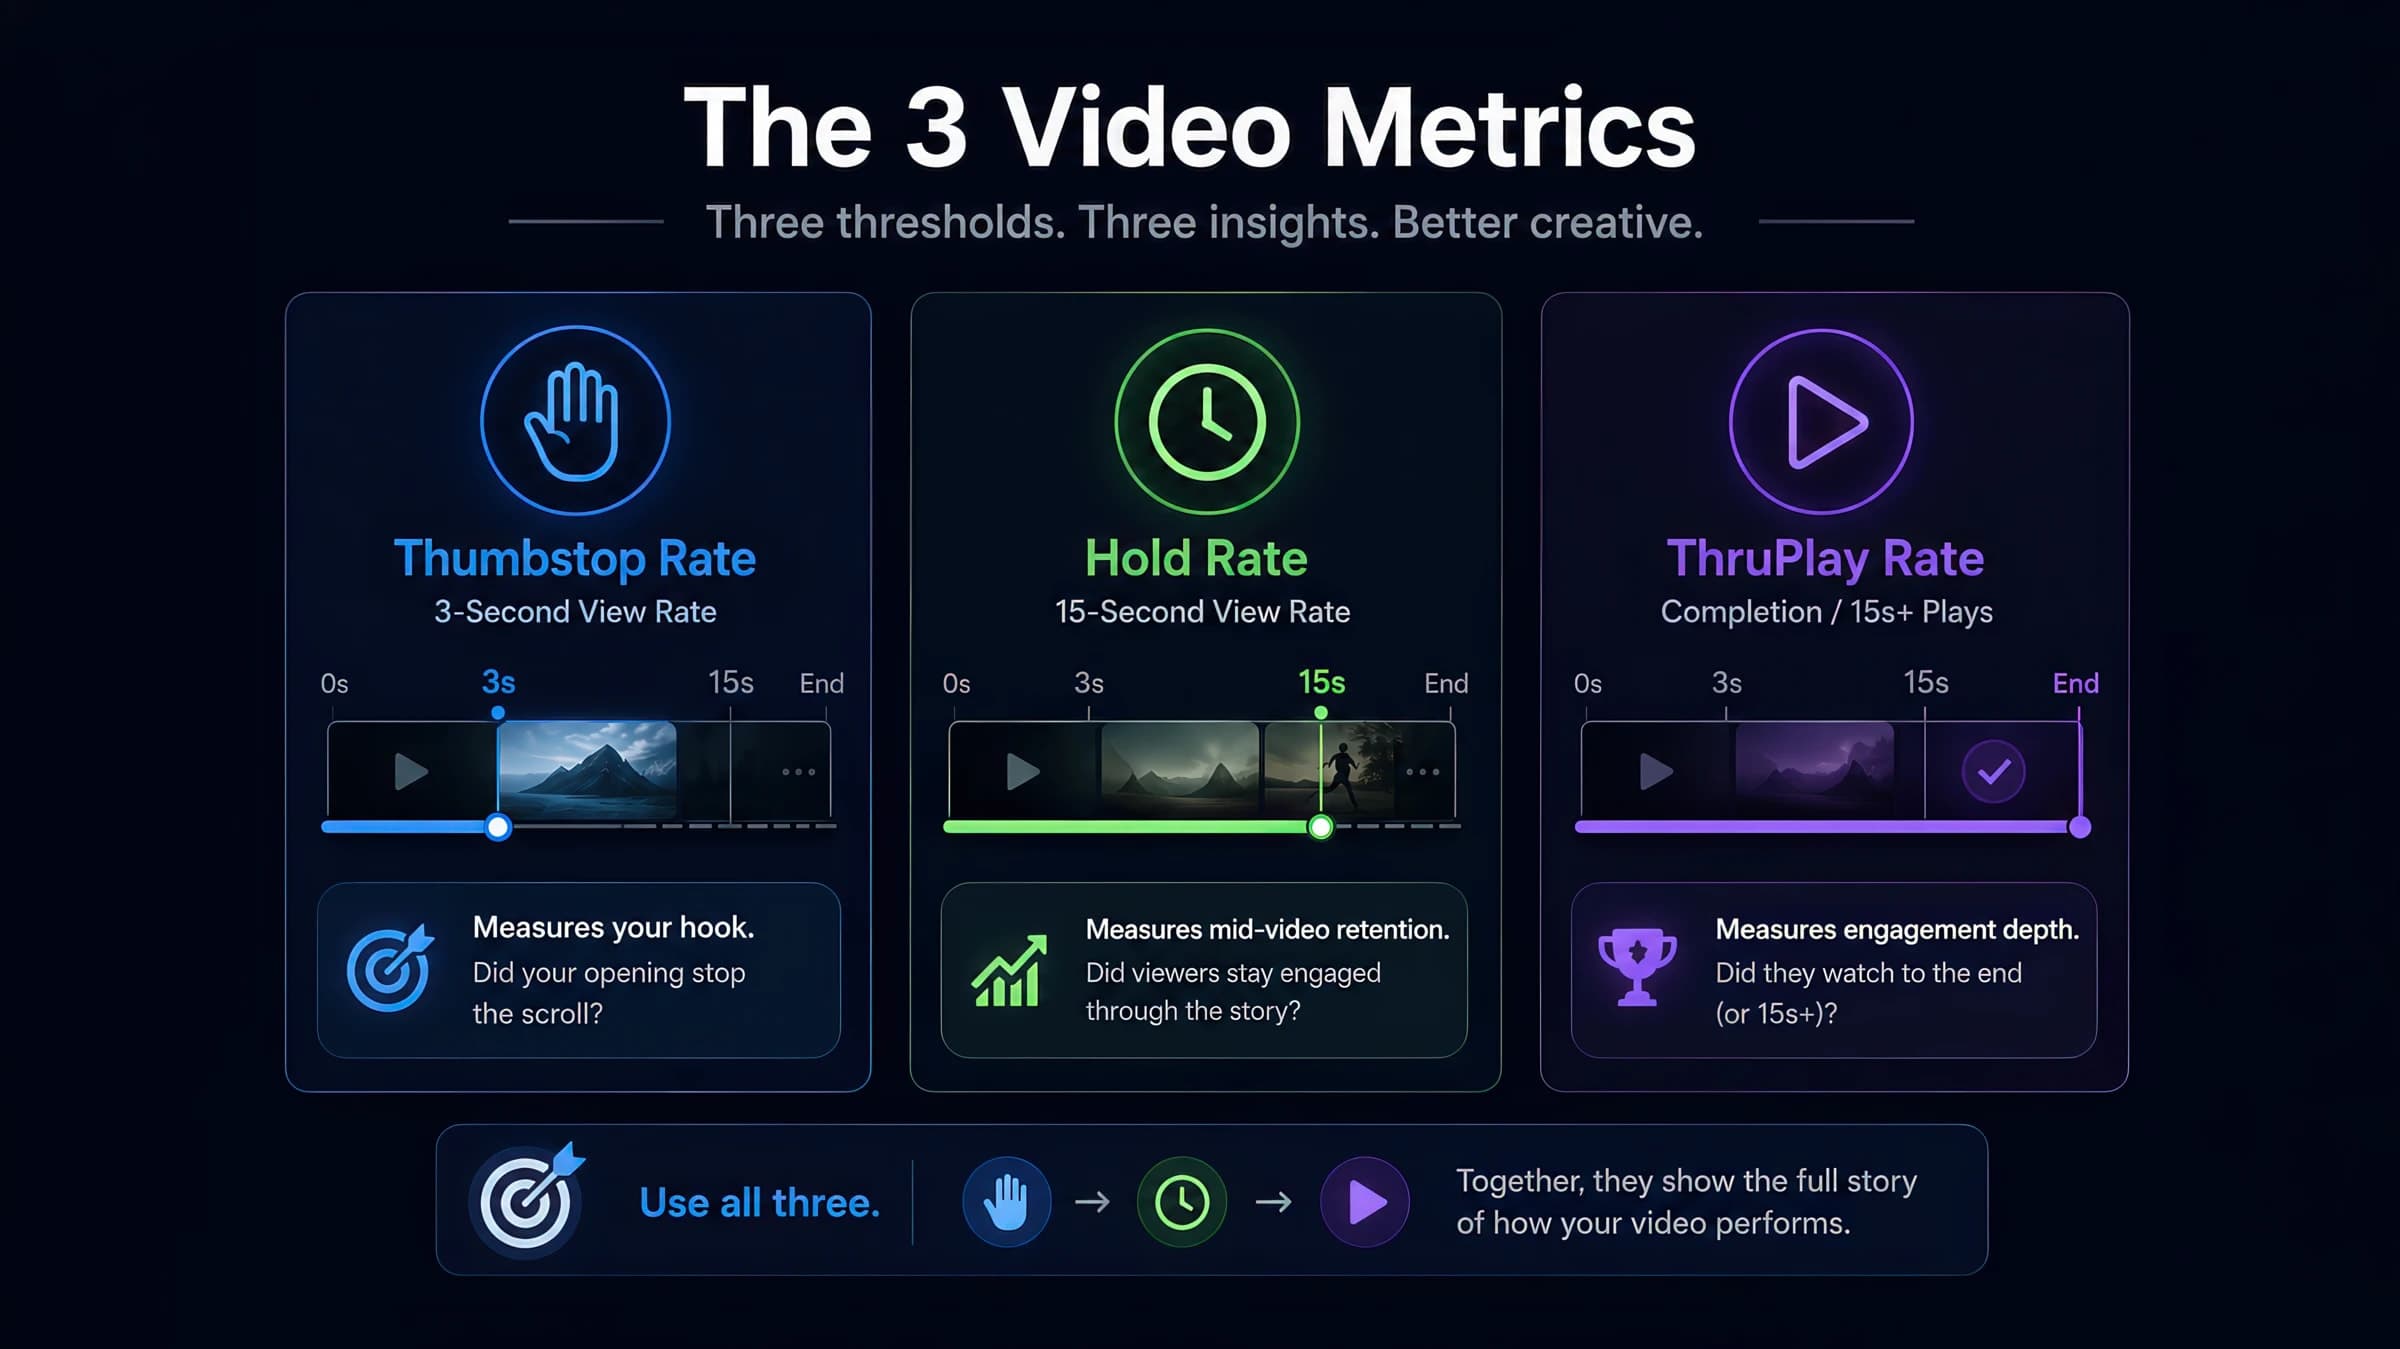
| ThruPlay rate | Completion or 15s+ plays ÷ video plays | Engagement depth + hook testing |
| Hold rate | % still watching at timestamp X | Hook and mid-roll retention diagnosis |
| VCR | Full video views / impressions | Short-form completion (Reels, Stories) |
| Thumbstop rate | 3s views / impressions | Scroll-stopping hook strength |
When ThruPlay Rate Misleads You
Three common ways a healthy-looking ThruPlay rate hides a real problem.
- A strong hook can inflate ThruPlay from viewers who never convert — pair it with CTR, landing-page CVR, and ROAS before declaring a creative a winner.
- Aggregate ThruPlay across mixed creative lengths mostly reports the length mix, not creative quality. Segment by length before comparing.
- Retargeting audiences hold longer than cold prospecting; never compare the two against one baseline.
Free Tool
ThruPlay Rate Benchmark Analyzer
Grade your own ThruPlay rate against platform and vertical benchmarks interactively.
See our ThruPlay vs VCR comparison for a deeper side-by-side breakdown of what each metric owns.
Diagnostic Workflow for Low ThruPlay
When ThruPlay rate underperforms, work through this sequence before re-cutting creative.
- 1
Check thumbstop rate first
If fewer than 20% of impressions reach 3 seconds, the problem is the hook — not the body. Fix the first 1–3 seconds before editing the rest of the video.
Tip: Use the Creative Quality Grader to score hook strength against benchmarks.
- 2
Plot your drop-off curve
Map retention at 3s, 25%, 50%, 75%, and 100%. A cliff at 3–5s is a hook failure. A gradual slope is a pacing or story problem. A late cliff suggests your CTA or payoff is weak.
- 3
Segment by placement
Reels, Feed, and Stories have different baseline ThruPlay rates. A "low" aggregate rate may hide a winning Reels placement dragged down by underperforming Feed delivery.
- 4
Compare against your own history
Platform benchmarks are directional. Your account's historical top-quartile creative is the most relevant comparison — especially for retargeting vs prospecting splits.
Free Tool
Video Drop-off Calculator
Model retention curves and identify where viewers leave your video.
Key Takeaways
- ThruPlay counts sub-15s completions + 15s+ plays (not clicks) — check hold rate for true watch depth
- Diagnose hook (thumbstop) before body (retention)
- Segment by placement before killing a variant
- Compare to your own top performers, not just industry medians
Frequently Asked Questions
Related Tools & Guides
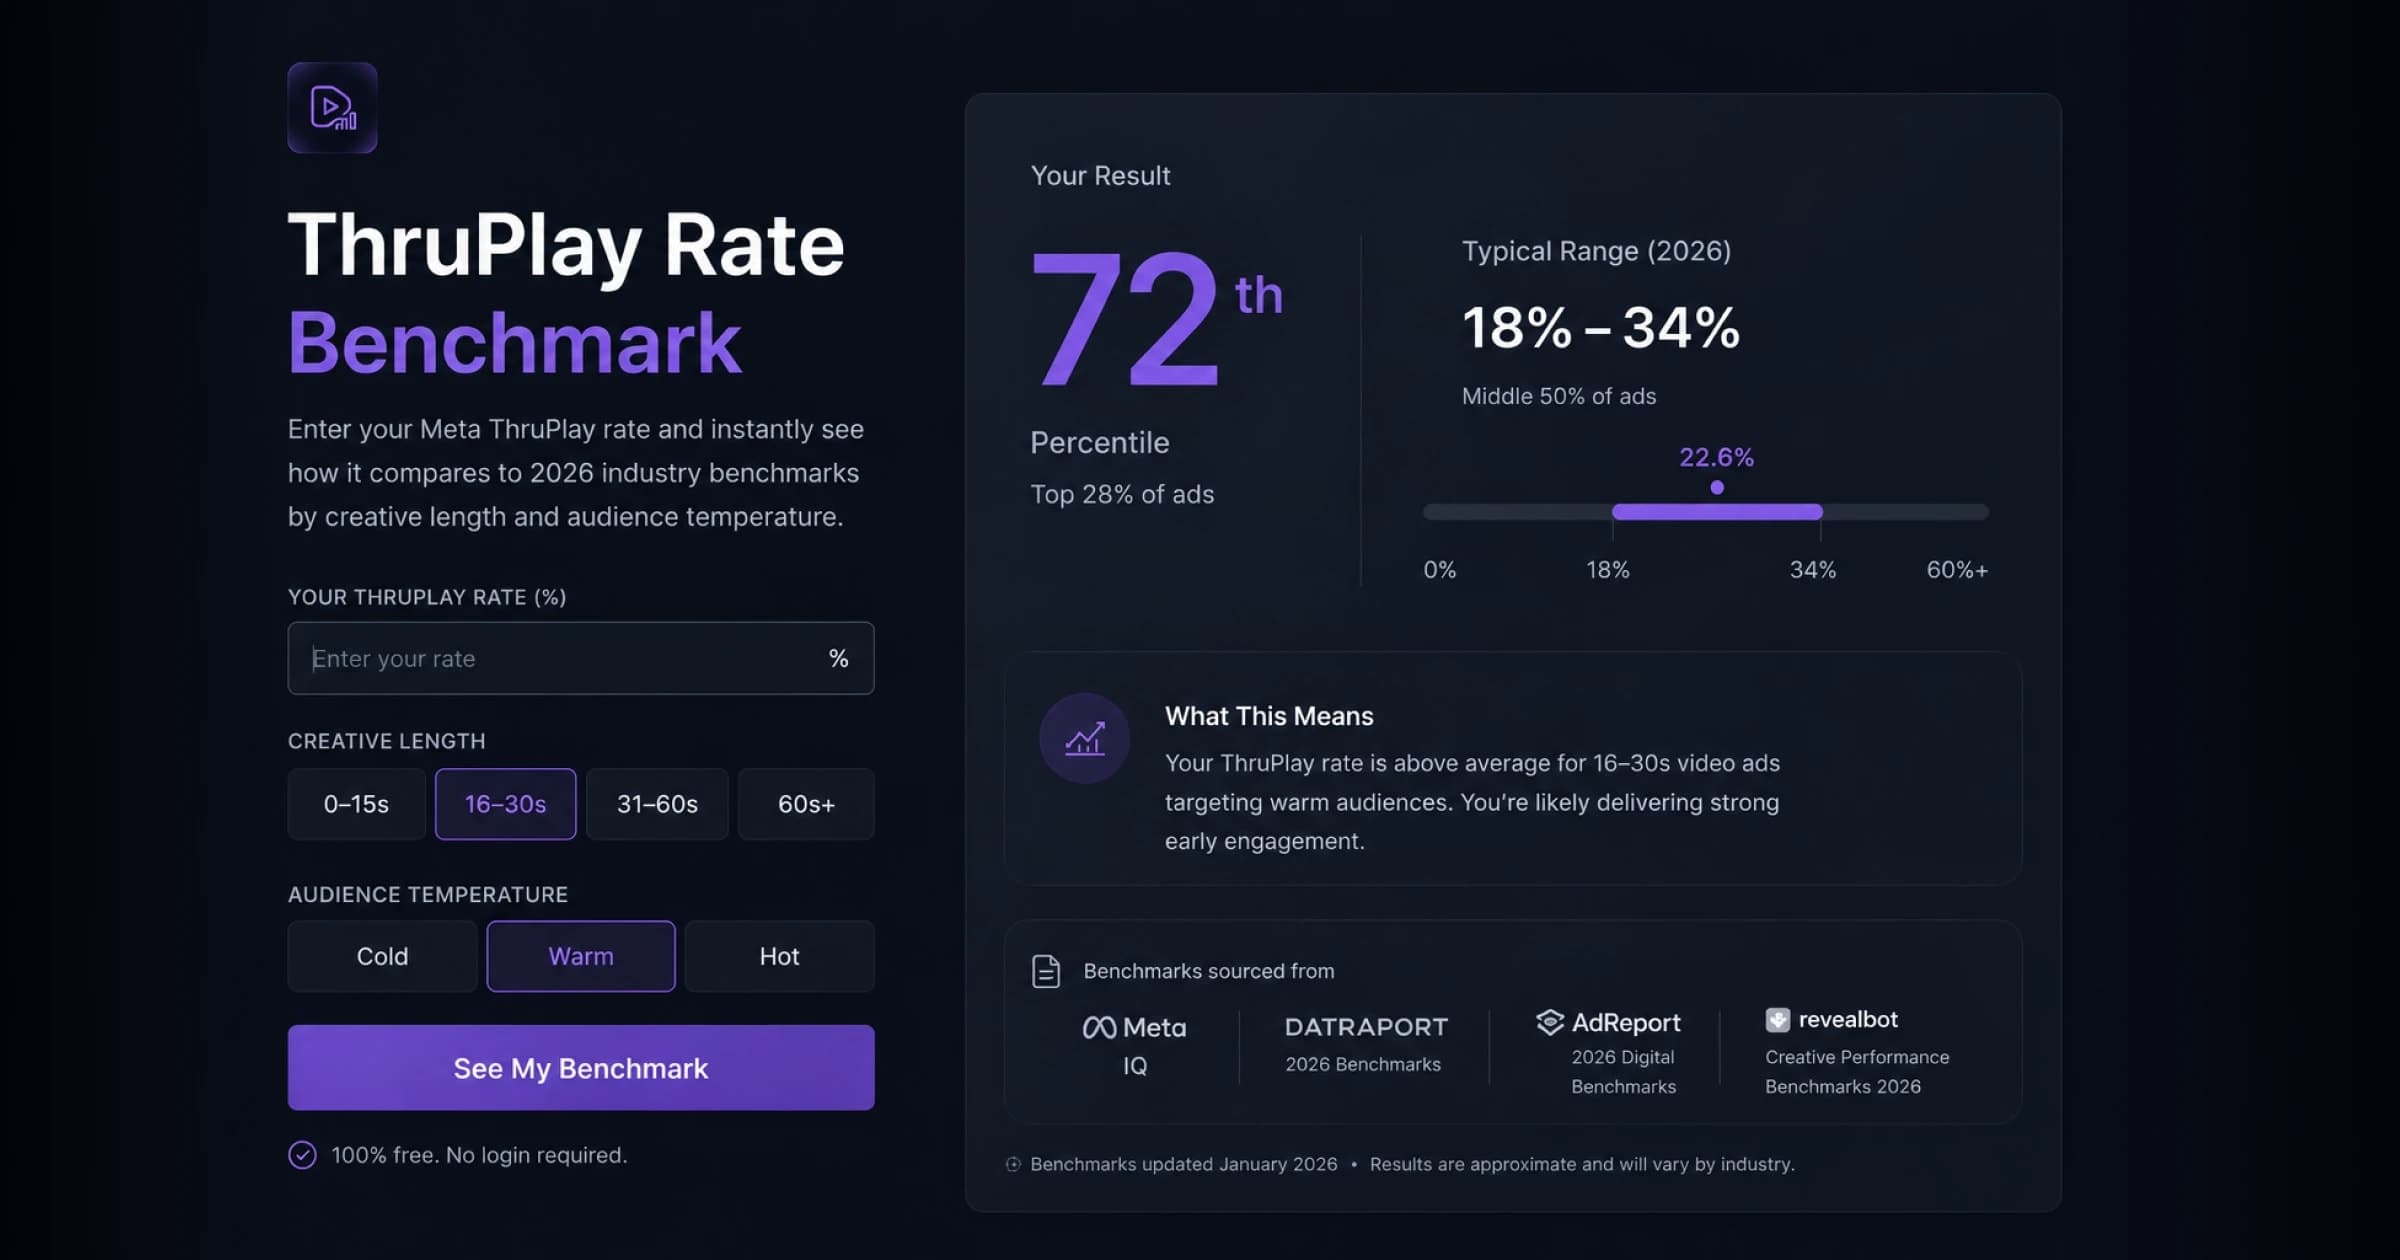
ThruPlay Rate Benchmark
Enter your Meta ThruPlay rate and instantly see how it compares to 2026 industry benchmarks by creative length and audience temperature. Free, no login — see where you land vs the cited typical range, with sources, and what your number means for creative performance.

Video Retention & Drop-Off Calculator
Analyze audience drop-off and retention to find exactly where viewers stop watching your videos. Works for YouTube, Vimeo, TikTok, and Facebook analytics data.
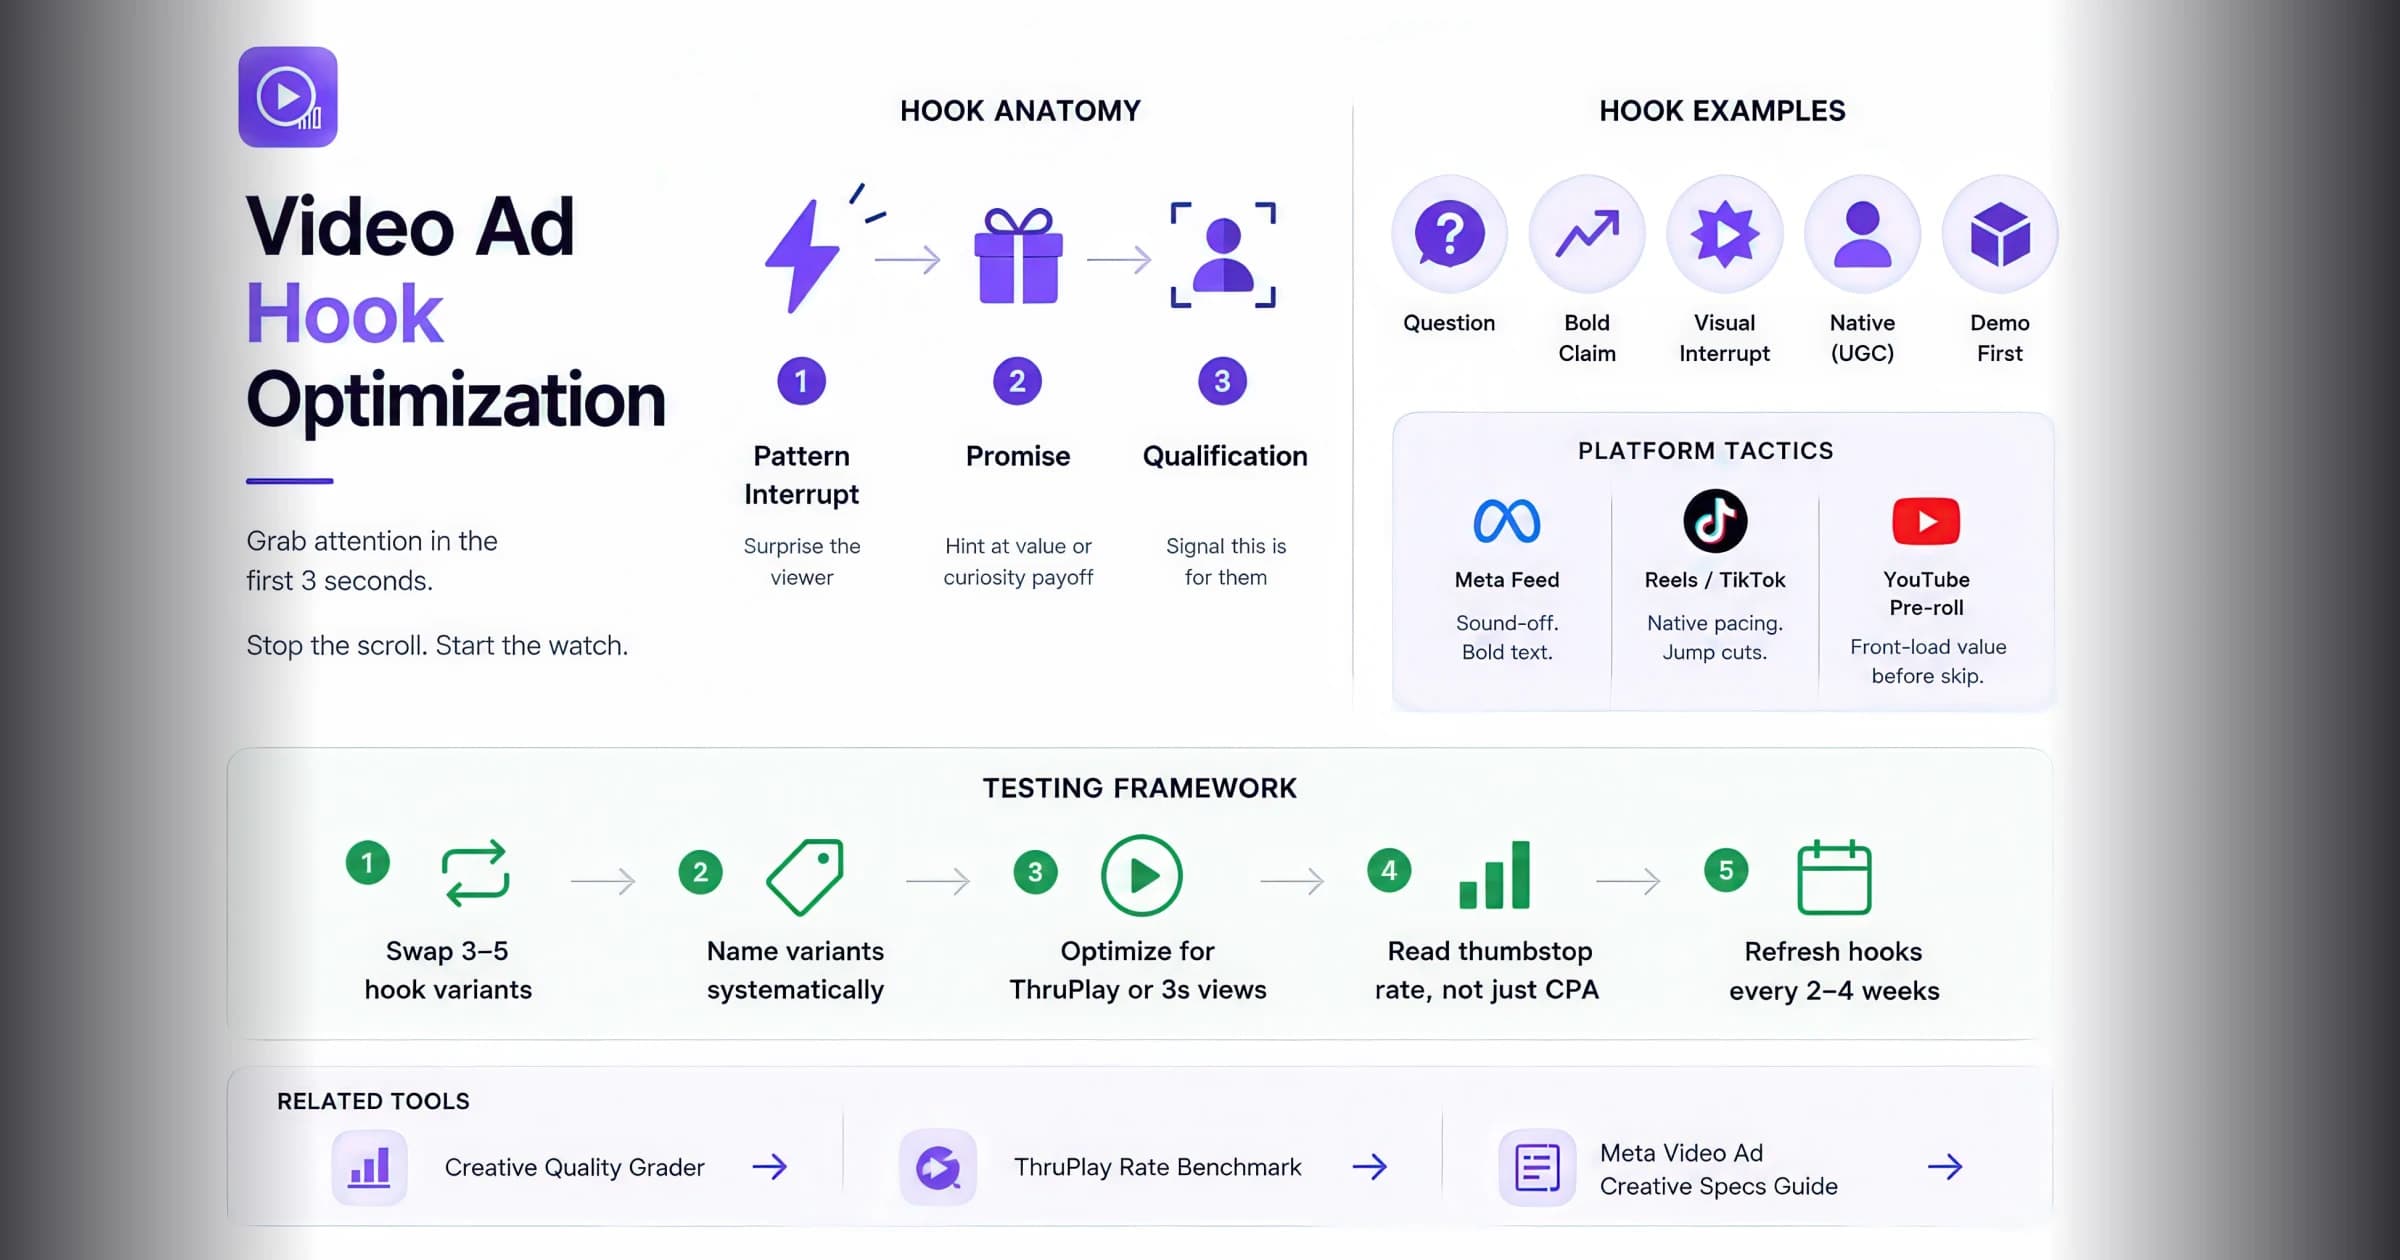
Video Ad Hook Optimization: Win the First 3 Seconds
Master the anatomy of high-performing video ad hooks — pattern interrupts, thumbstop tactics, platform-specific formats, and a repeatable testing framework for the first 3 seconds of your creative.
Video Creative Metrics Benchmarks 2026: Thumbstop, Hold & ThruPlay
Cited 2026 benchmark ranges for thumbstop rate, hold rate, and ThruPlay on Meta — with segmentation rules, source links, and interactive analyzers to score your creative.

Creative Quality Grader
Grade your ad creatives and get actionable recommendations for improvement. This creative quality grader tool evaluates key elements like visual design, messaging, CTAs, accessibility, and platform optimization to help you create high-performing ads across Facebook, Instagram, TikTok, and YouTube. Get detailed scores and personalized tips to optimize your creative strategy.