Guide
Benchmarks & how to read your result
How to read and act on your result — research-backed context with linked sources for every benchmark cited.
What makes B2B ROAS different?
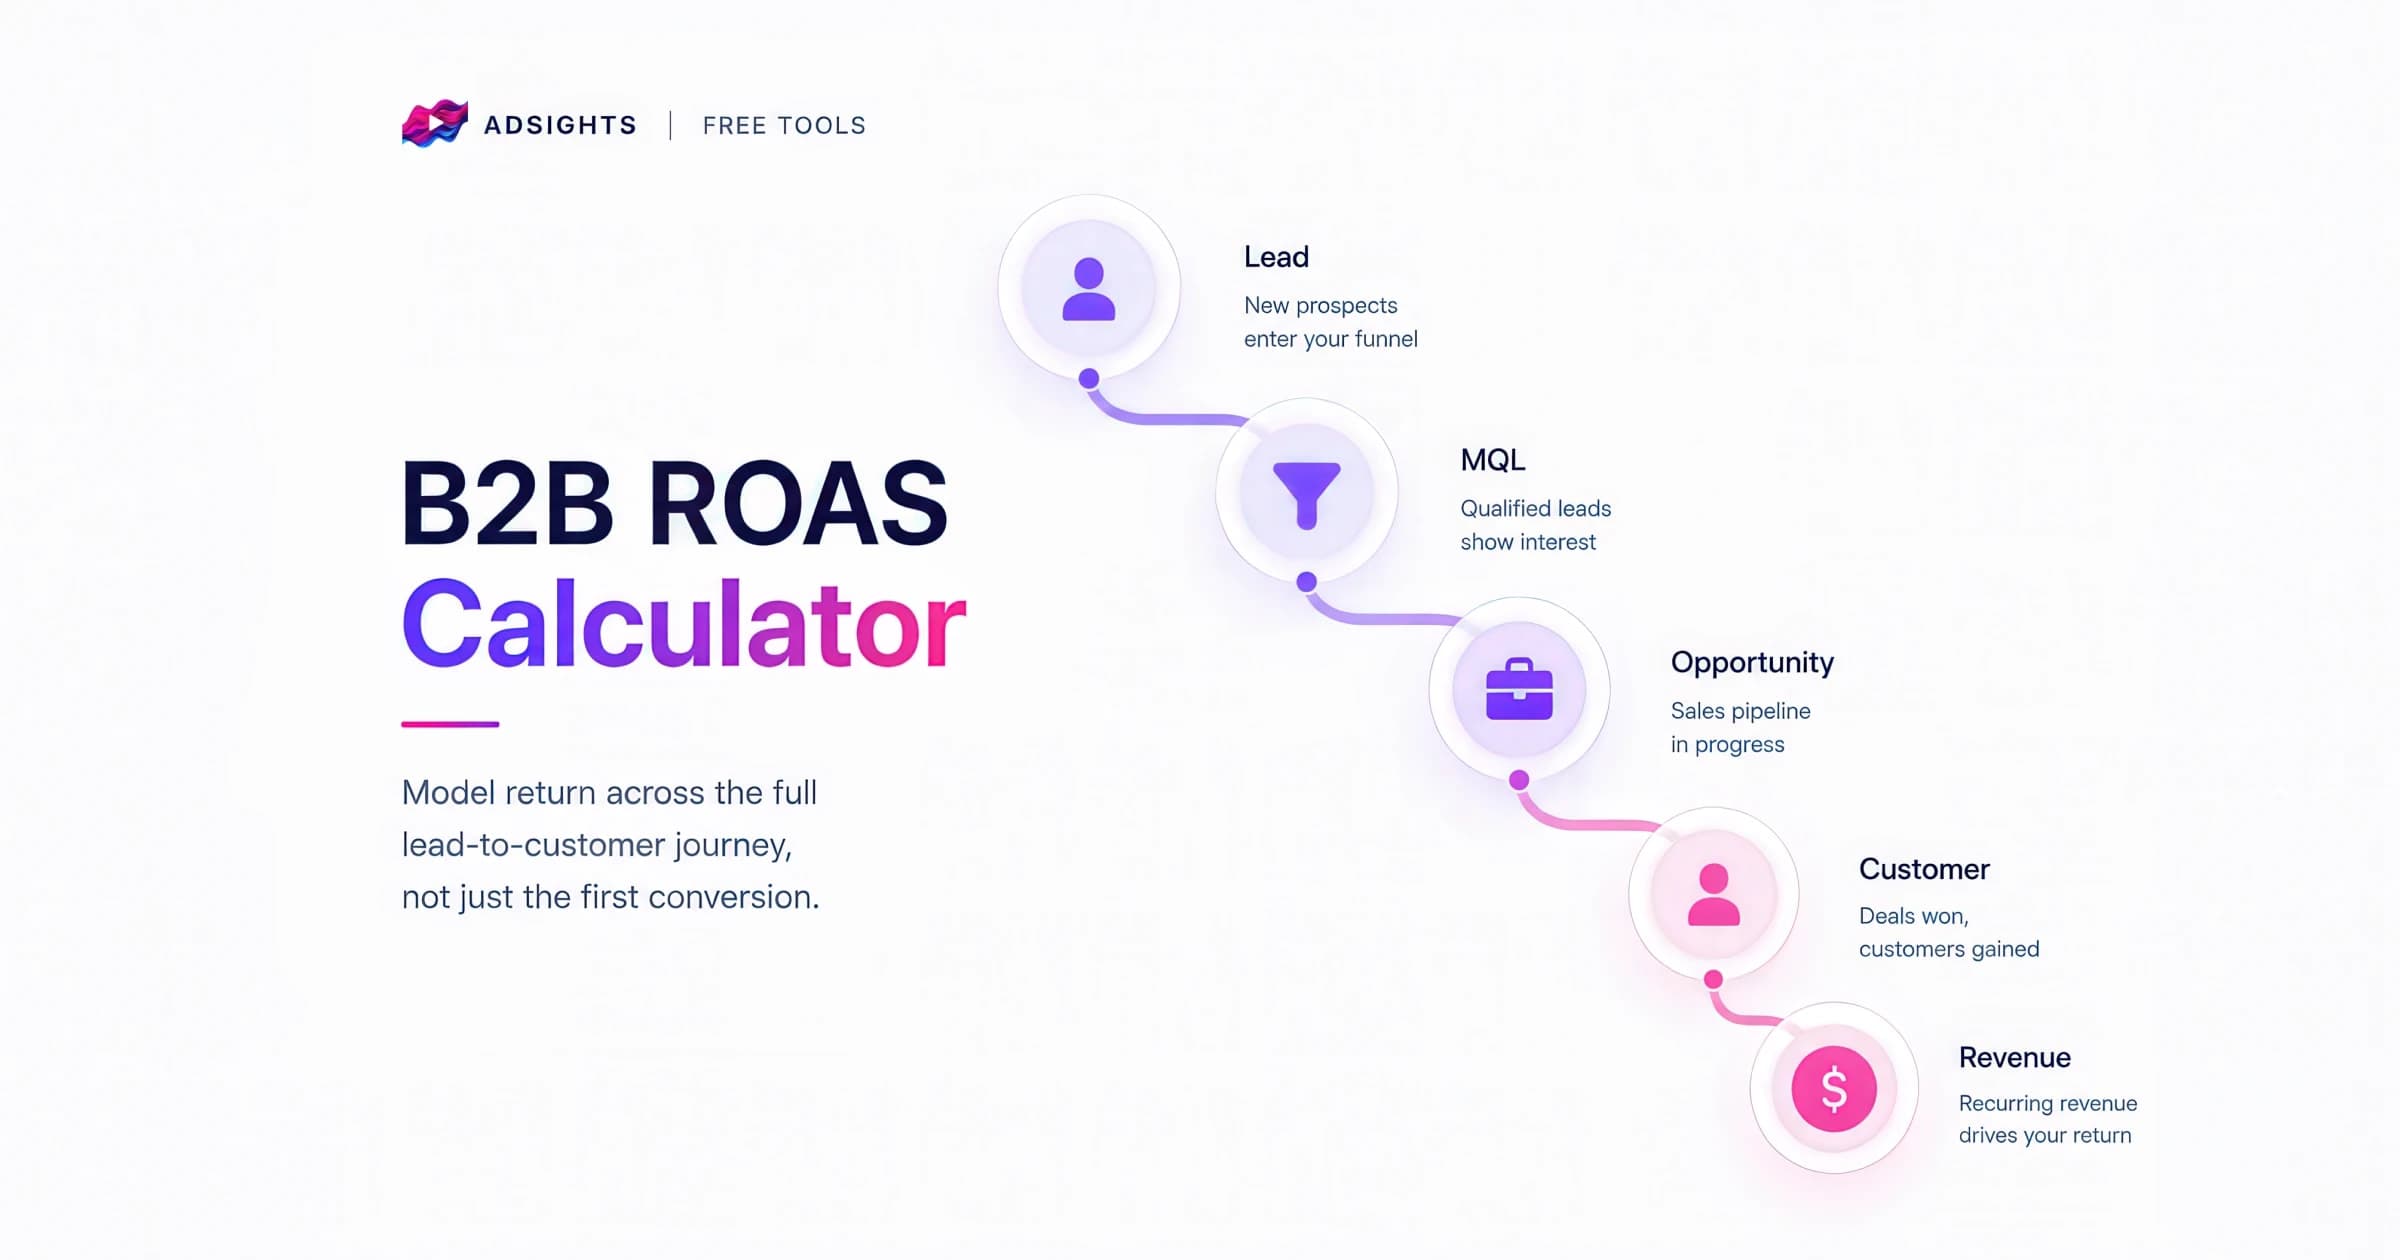
In eCommerce, a conversion is a sale, so revenue is immediate and ROAS is straightforward. In B2B, a conversion is usually a lead that may close weeks or months later, so immediate-revenue ROAS dramatically understates performance. A B2B ROAS calculation has to step through the journey: clicks → leads → customers (via your lead-to-customer rate) → revenue (via average deal value).
How B2B ROAS is Calculated
ROAS = Total Revenue ÷ Ad Spend, where revenue = leads × lead-to-customer rate × average deal value.
The calculator boots on the B2B tab so the lead-to-customer steps are built in: it derives leads from clicks and conversion rate, customers from your lead-to-customer rate, and revenue from average deal value — then divides revenue by spend for ROAS.
B2B ROAS worked example
$20,000 LinkedIn spend → 400 clicks ($50 CPC) → 40 leads (10% CVR) → 2 customers (5% lead-to-close) → $30,000 ACV = $60,000 revenue
ROAS = $60,000 ÷ $20,000 = 3.0×
Immediate-revenue ROAS (counting leads only, $0 closed) = 0× — why B2B needs a lead-to-customer rate input. Without it, you would kill profitable pipeline campaigns.
What lead-to-customer rate to use
Inbound MQL → closed-won
- Typical lead-to-customer (L2C) rate
- 1–5%
Demo request → closed-won
- Typical lead-to-customer (L2C) rate
- 10–25%
Enterprise outbound
- Typical lead-to-customer (L2C) rate
- 0.5–2%
Product-led trial → paid
- Typical lead-to-customer (L2C) rate
- 5–15%
| Motion | Typical lead-to-customer (L2C) rate |
|---|---|
| Inbound MQL → closed-won | 1–5% |
| Demo request → closed-won | 10–25% |
| Enterprise outbound | 0.5–2% |
| Product-led trial → paid | 5–15% |
Use your own historical close rate from marketing-qualified lead to closed-won if you have it. In long B2B cycles the L2C rate is usually the single biggest driver of true ROAS.
B2B ROAS benchmarks
LinkedIn (ABM / demand gen)
- Typical ROAS range
- 2.0× – 4.0×
- Notes
- High CPC, high deal value
Google Search (high-intent B2B)
- Typical ROAS range
- 3.0× – 6.0×
- Notes
- "Pricing" and "demo" queries
Meta (B2B lead gen)
- Typical ROAS range
- 1.5× – 3.5×
- Notes
- Lower CPC, longer nurture
Blended B2B SaaS (multi-touch)
- Typical ROAS range
- 3.0× – 5.0×
- Notes
- FirstPageSage 2025 Marketing ROI
| Channel / motion | Typical ROAS range | Notes |
|---|---|---|
| LinkedIn (ABM / demand gen) | 2.0× – 4.0× | High CPC, high deal value |
| Google Search (high-intent B2B) | 3.0× – 6.0× | "Pricing" and "demo" queries |
| Meta (B2B lead gen) | 1.5× – 3.5× | Lower CPC, longer nurture |
| Blended B2B SaaS (multi-touch) | 3.0× – 5.0× | FirstPageSage 2025 Marketing ROI |
Why B2B accepts lower first-order ROAS
B2B customer lifetime value is typically much larger and more durable: a single closed account can pay back acquisition cost many times over across a multi-year contract. A 2.0× first-campaign ROAS on a $30k ACV deal with 3-year retention is often excellent when LTV:CAC exceeds 3:1.
Use the Customer Lifetime Value Calculator to model payback beyond the first closed deal.
Common mistakes
- Judging B2B ads on same-day ROAS — pipeline needs L2C rate and deal value.
- Using eCommerce conversion rates for B2B landing pages (1–3% is normal for cold traffic).
- Ignoring sales cycle length — a lead from Q1 may close in Q3; align reporting windows.
- Mixing MQL and SQL definitions across teams — L2C rate must use consistent stage definitions.
- Comparing LinkedIn ROAS to Google Shopping benchmarks — different intent and economics.
How to use this calculator
- Select the B2B business type tab (pre-selected on this page).
- Enter ad spend, CPC, and landing page conversion rate (lead form submits ÷ clicks).
- Enter your lead-to-customer rate and average deal value (ACV or first-year contract value).
- Read ROAS, leads, customers, and revenue — compare to your margin-adjusted target.
- Cross-check with MER for blended program health.
How to improve B2B ROAS
- Tighten audience targeting (job title, company size, intent signals).
- Improve landing page relevance and form friction (fewer fields for TOFU, more for BOFU).
- Nurture leads with email and retargeting — L2C rate often doubles with follow-up.
- Focus spend on demo-request and pricing-intent keywords.
- Align sales and marketing on lead quality scoring — volume without close rate destroys ROAS.
Methodology & sources
B2B ROAS ranges reflect multi-touch attribution and longer sales cycles. LinkedIn and Google Search rows use high-intent lead-gen benchmarks; blended SaaS rows include pipeline revenue recognized over 90+ days.
FirstPageSage Marketing ROI Report
B2B SaaS ROAS by channel
WordStream & LocaliQ Benchmarks
B2B lead-gen CPC and conversion baselines
Product-led trial-to-paid conversion context
B2B ROAS Calculator
Free B2B ROAS calculator that models return on ad spend across the full lead-to-customer journey — not just immediate conversions. Factor in lead-to-customer rate and deal value to see the true ROAS of B2B paid media with long sales cycles.
Free Calculator
No sign up required. Use this calculator as much as you need.
Stop calculating by hand
Want AI to track this across every creative variant — and tie it back to ROAS automatically? That’s what AdSights does.
Request early accessRelated Calculators
Full-Funnel Calculator
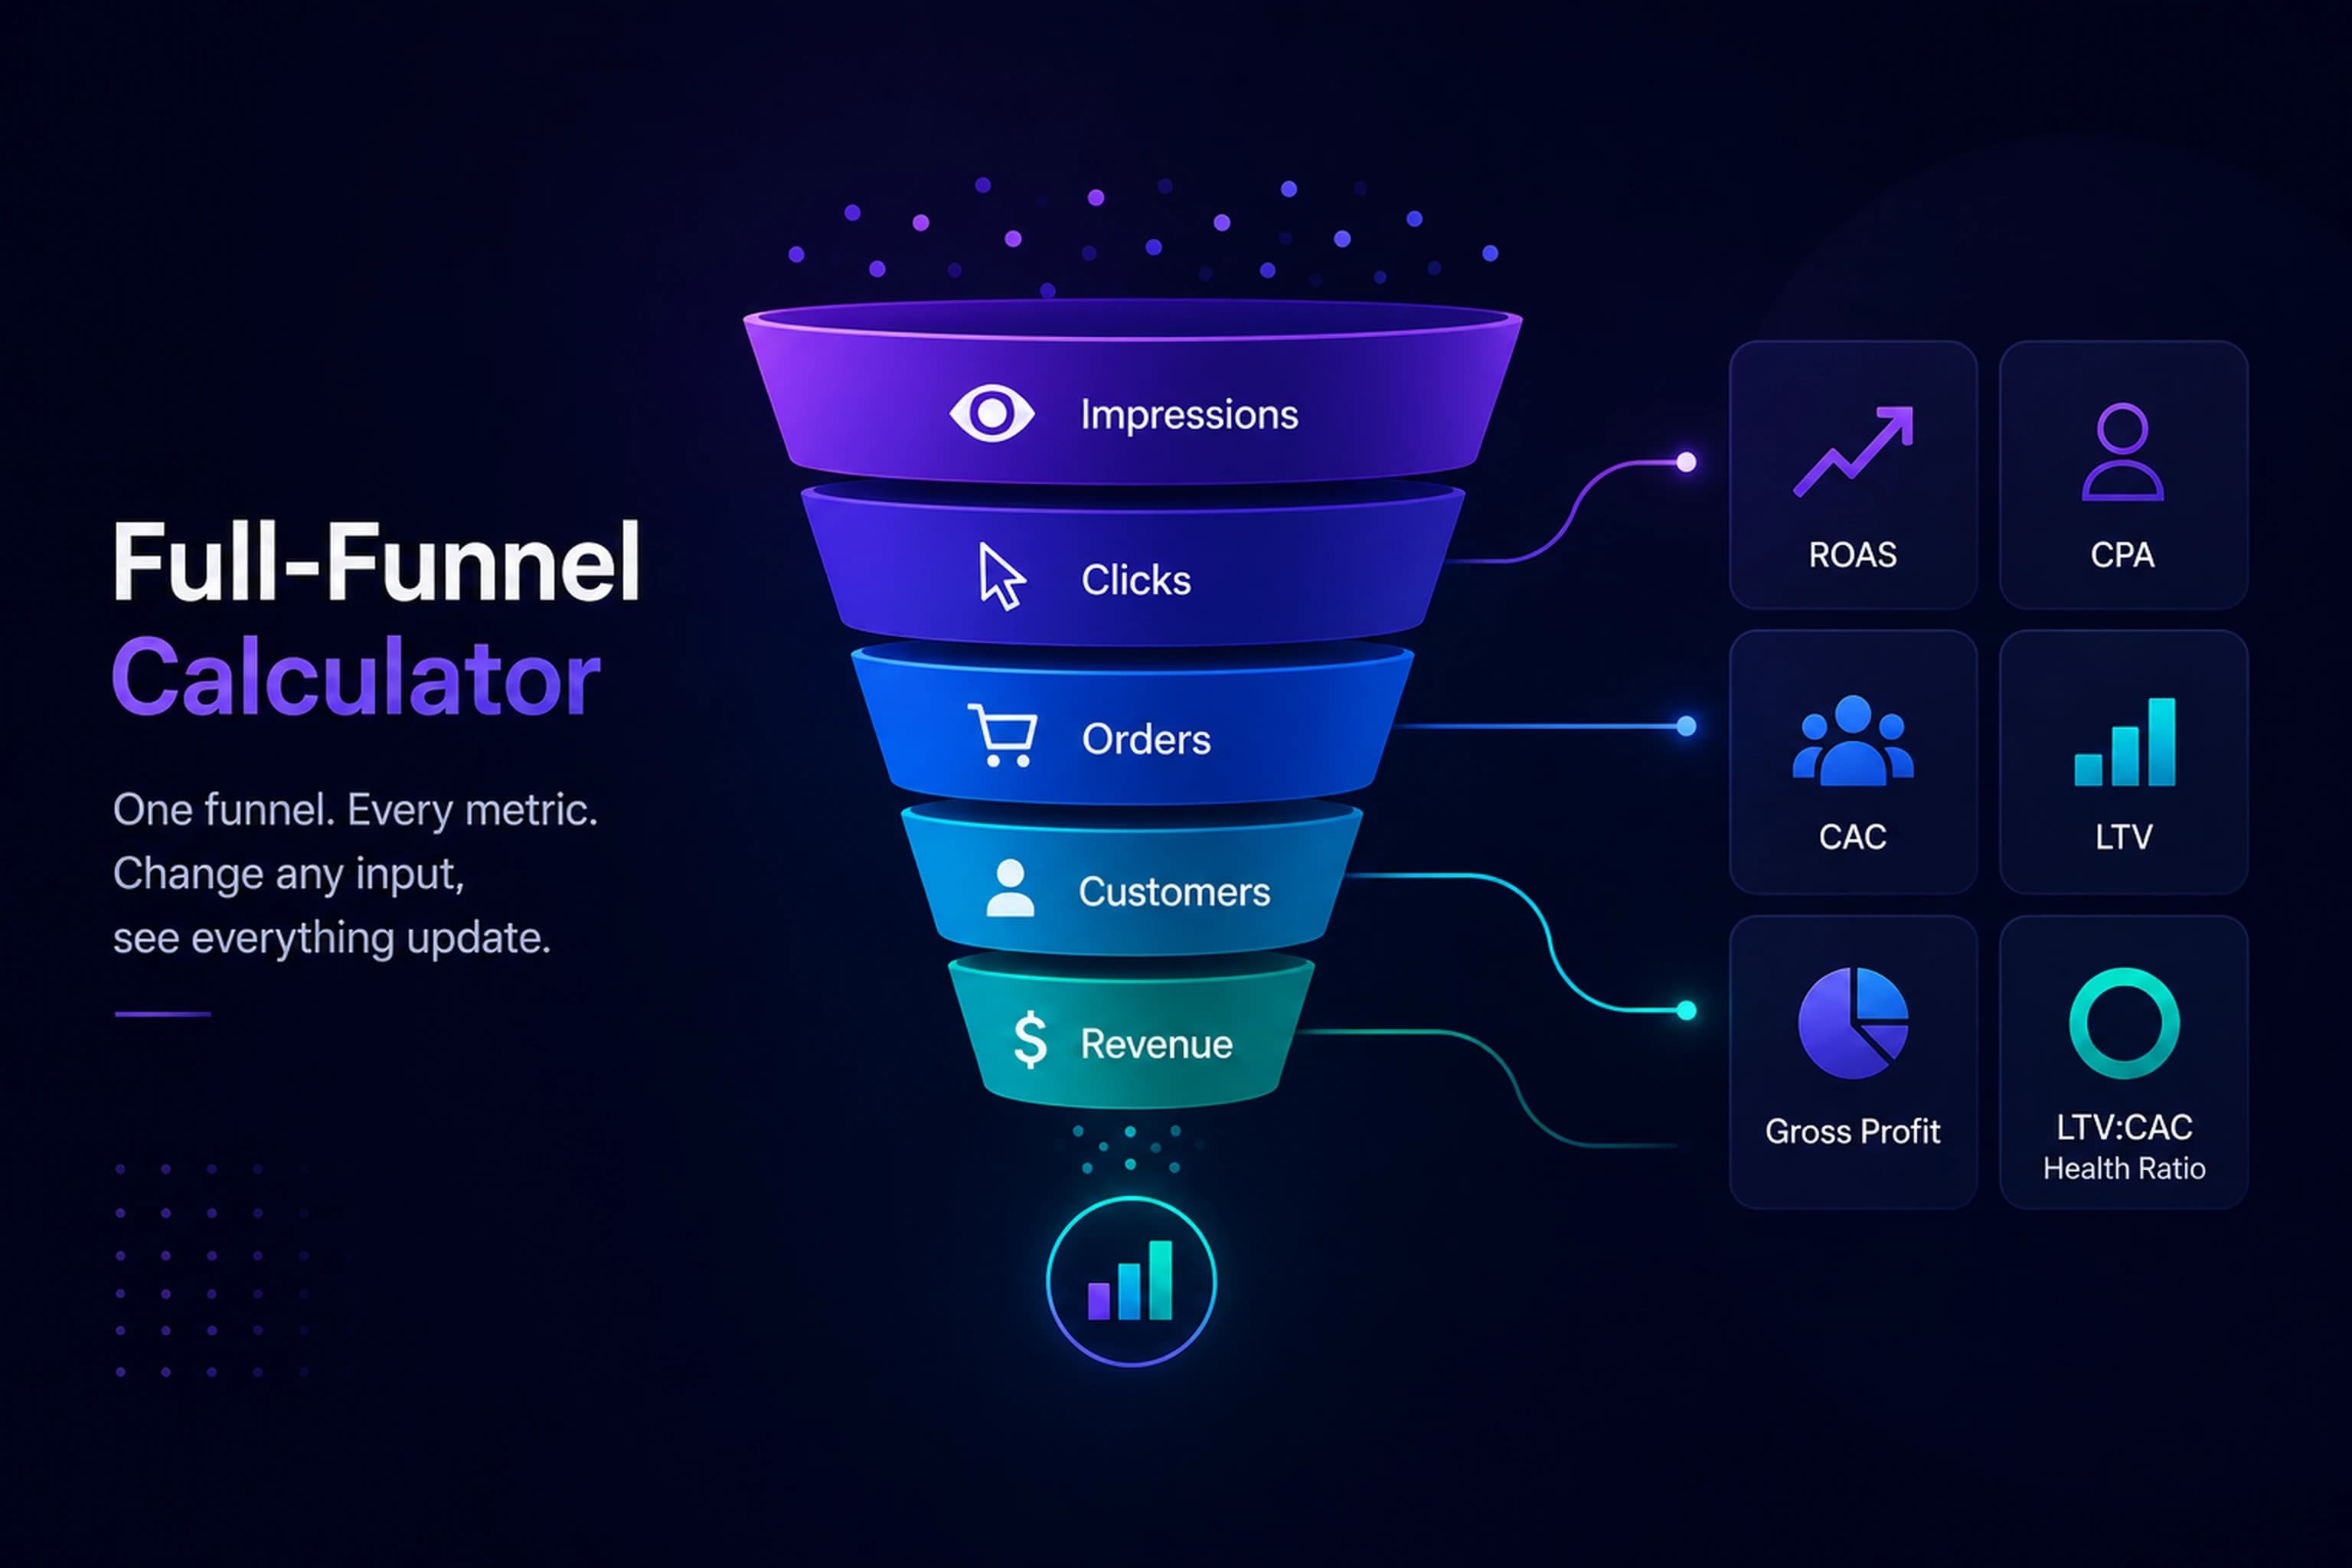
Model your entire paid-media funnel — impressions, CPM, CTR, CVR, and AOV — and instantly see ROAS, CPA, CAC, and LTV. Change any input to watch every downstream metric update, and gauge unit economics with an LTV:CAC health ratio.
ROAS Calculator
Calculate and analyze your return on ad spend (ROAS) to optimize campaign performance. Get data-driven insights on advertising efficiency, revenue attribution, and budget allocation to maximize marketing ROI.

CPA Calculator
Free CPA calculator: realized cost per acquisition from spend and conversions, funnel CPA from CPC or CPM × CTR × CVR, break-even CPA from margin, target CAC from LTV, and target CPA from ROAS — with cited 2026 lead-CPL and ecommerce-purchase bands. CSV export. No sign-up.
Related Analyzers
Paid Social Benchmarks
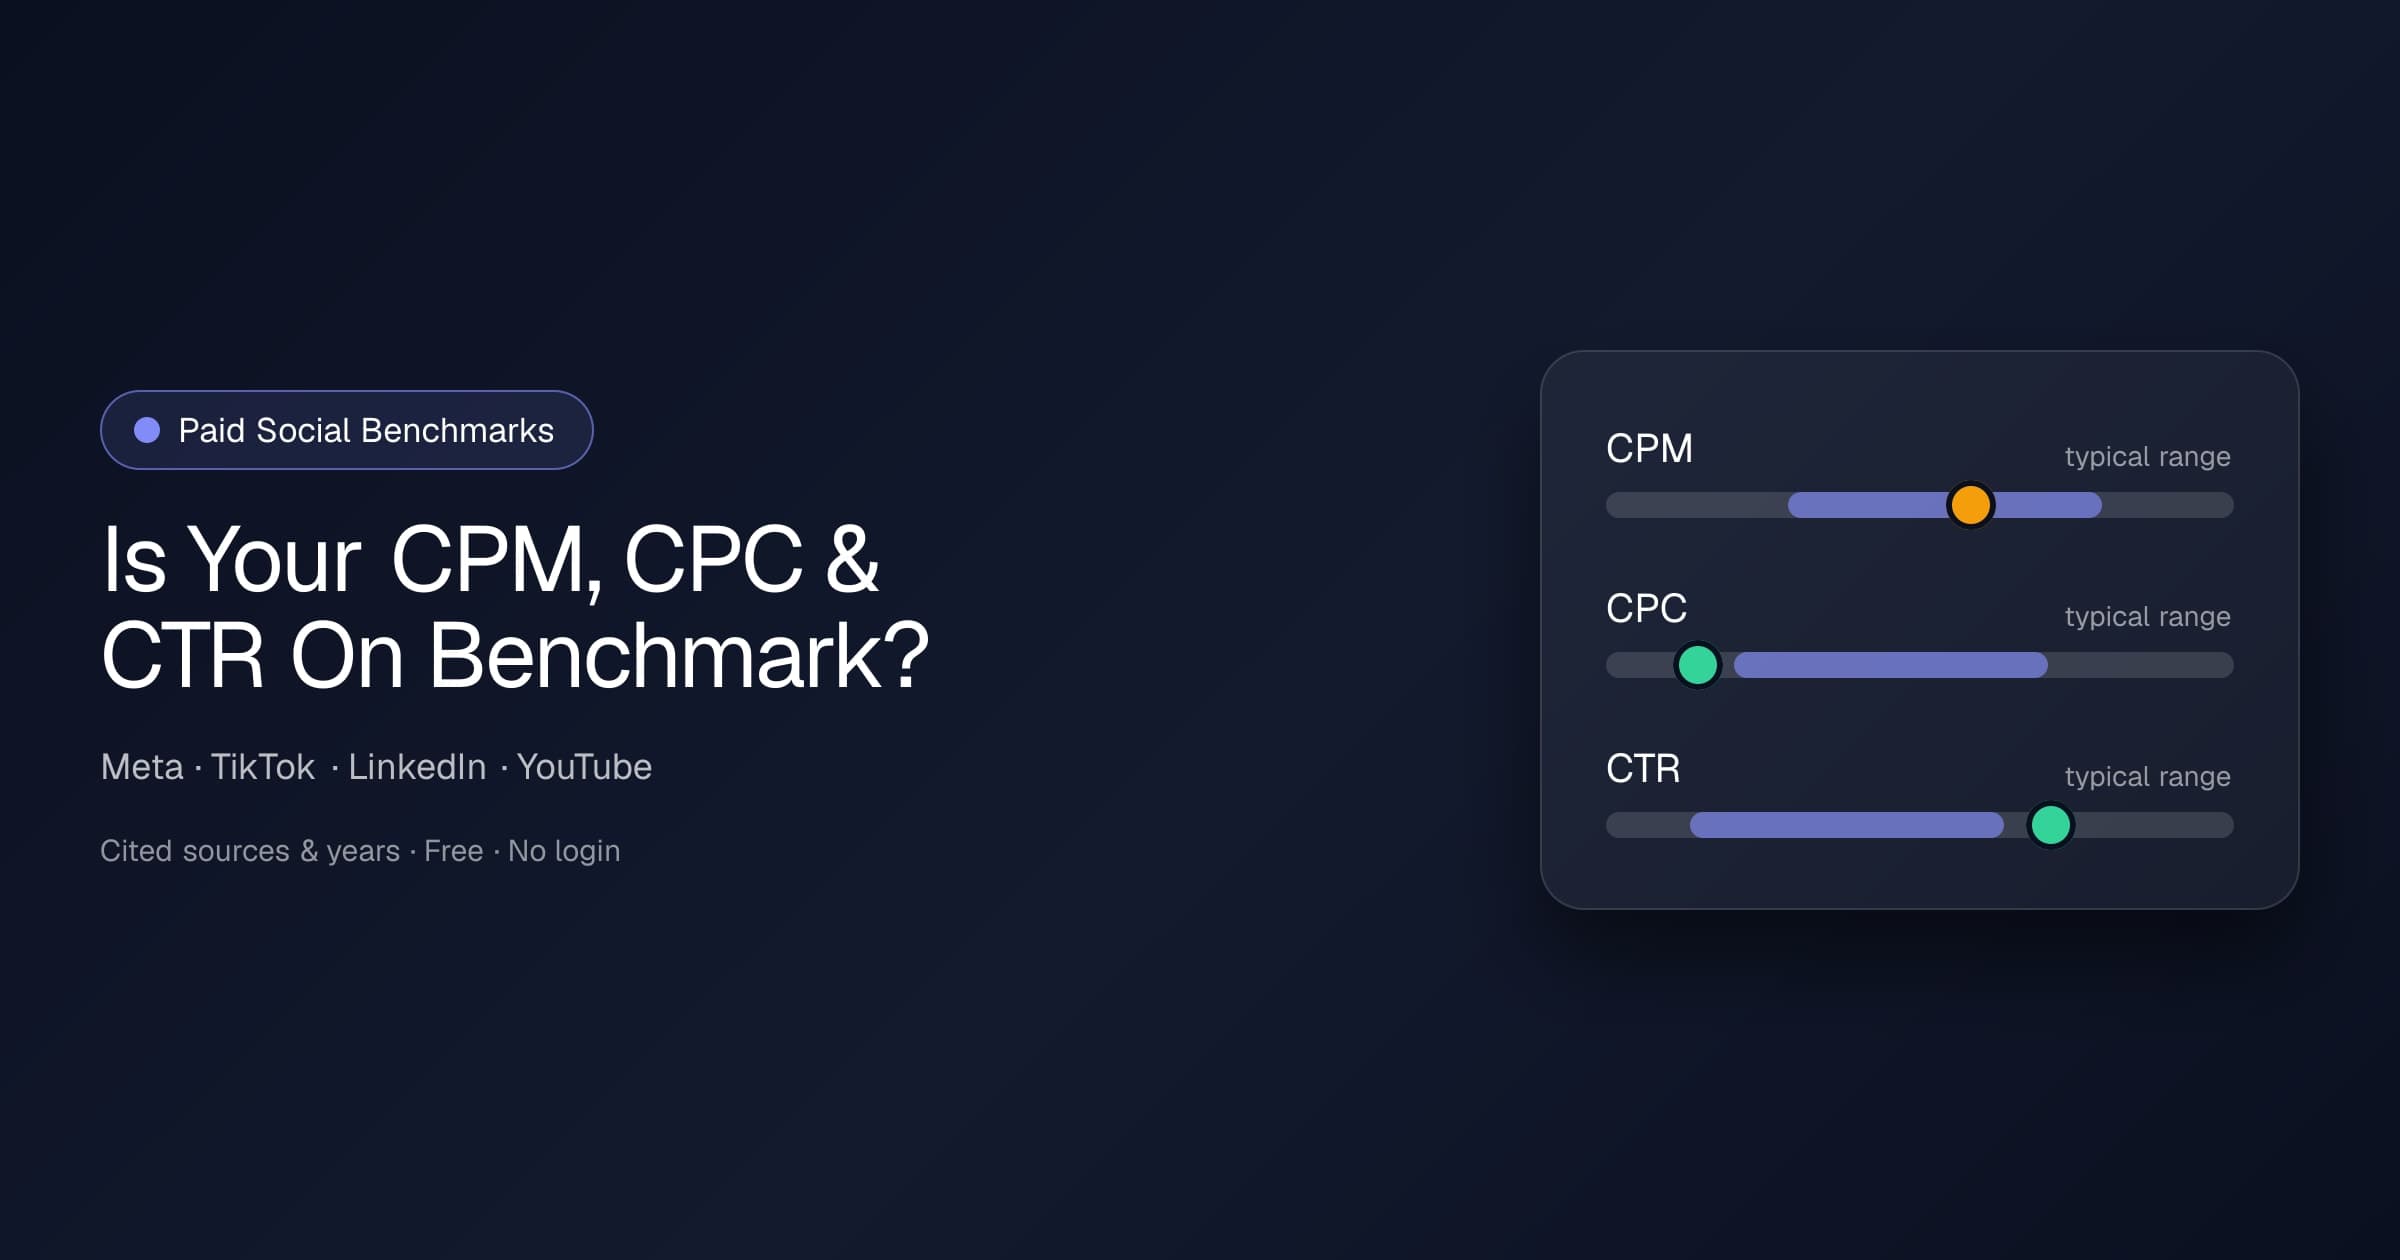
Enter your CPM, CPC, or CTR and see how it compares to current published benchmarks for Meta, TikTok, LinkedIn, and YouTube — segmented by campaign objective where the source splits them. Free, no login, every figure cited with source and year.
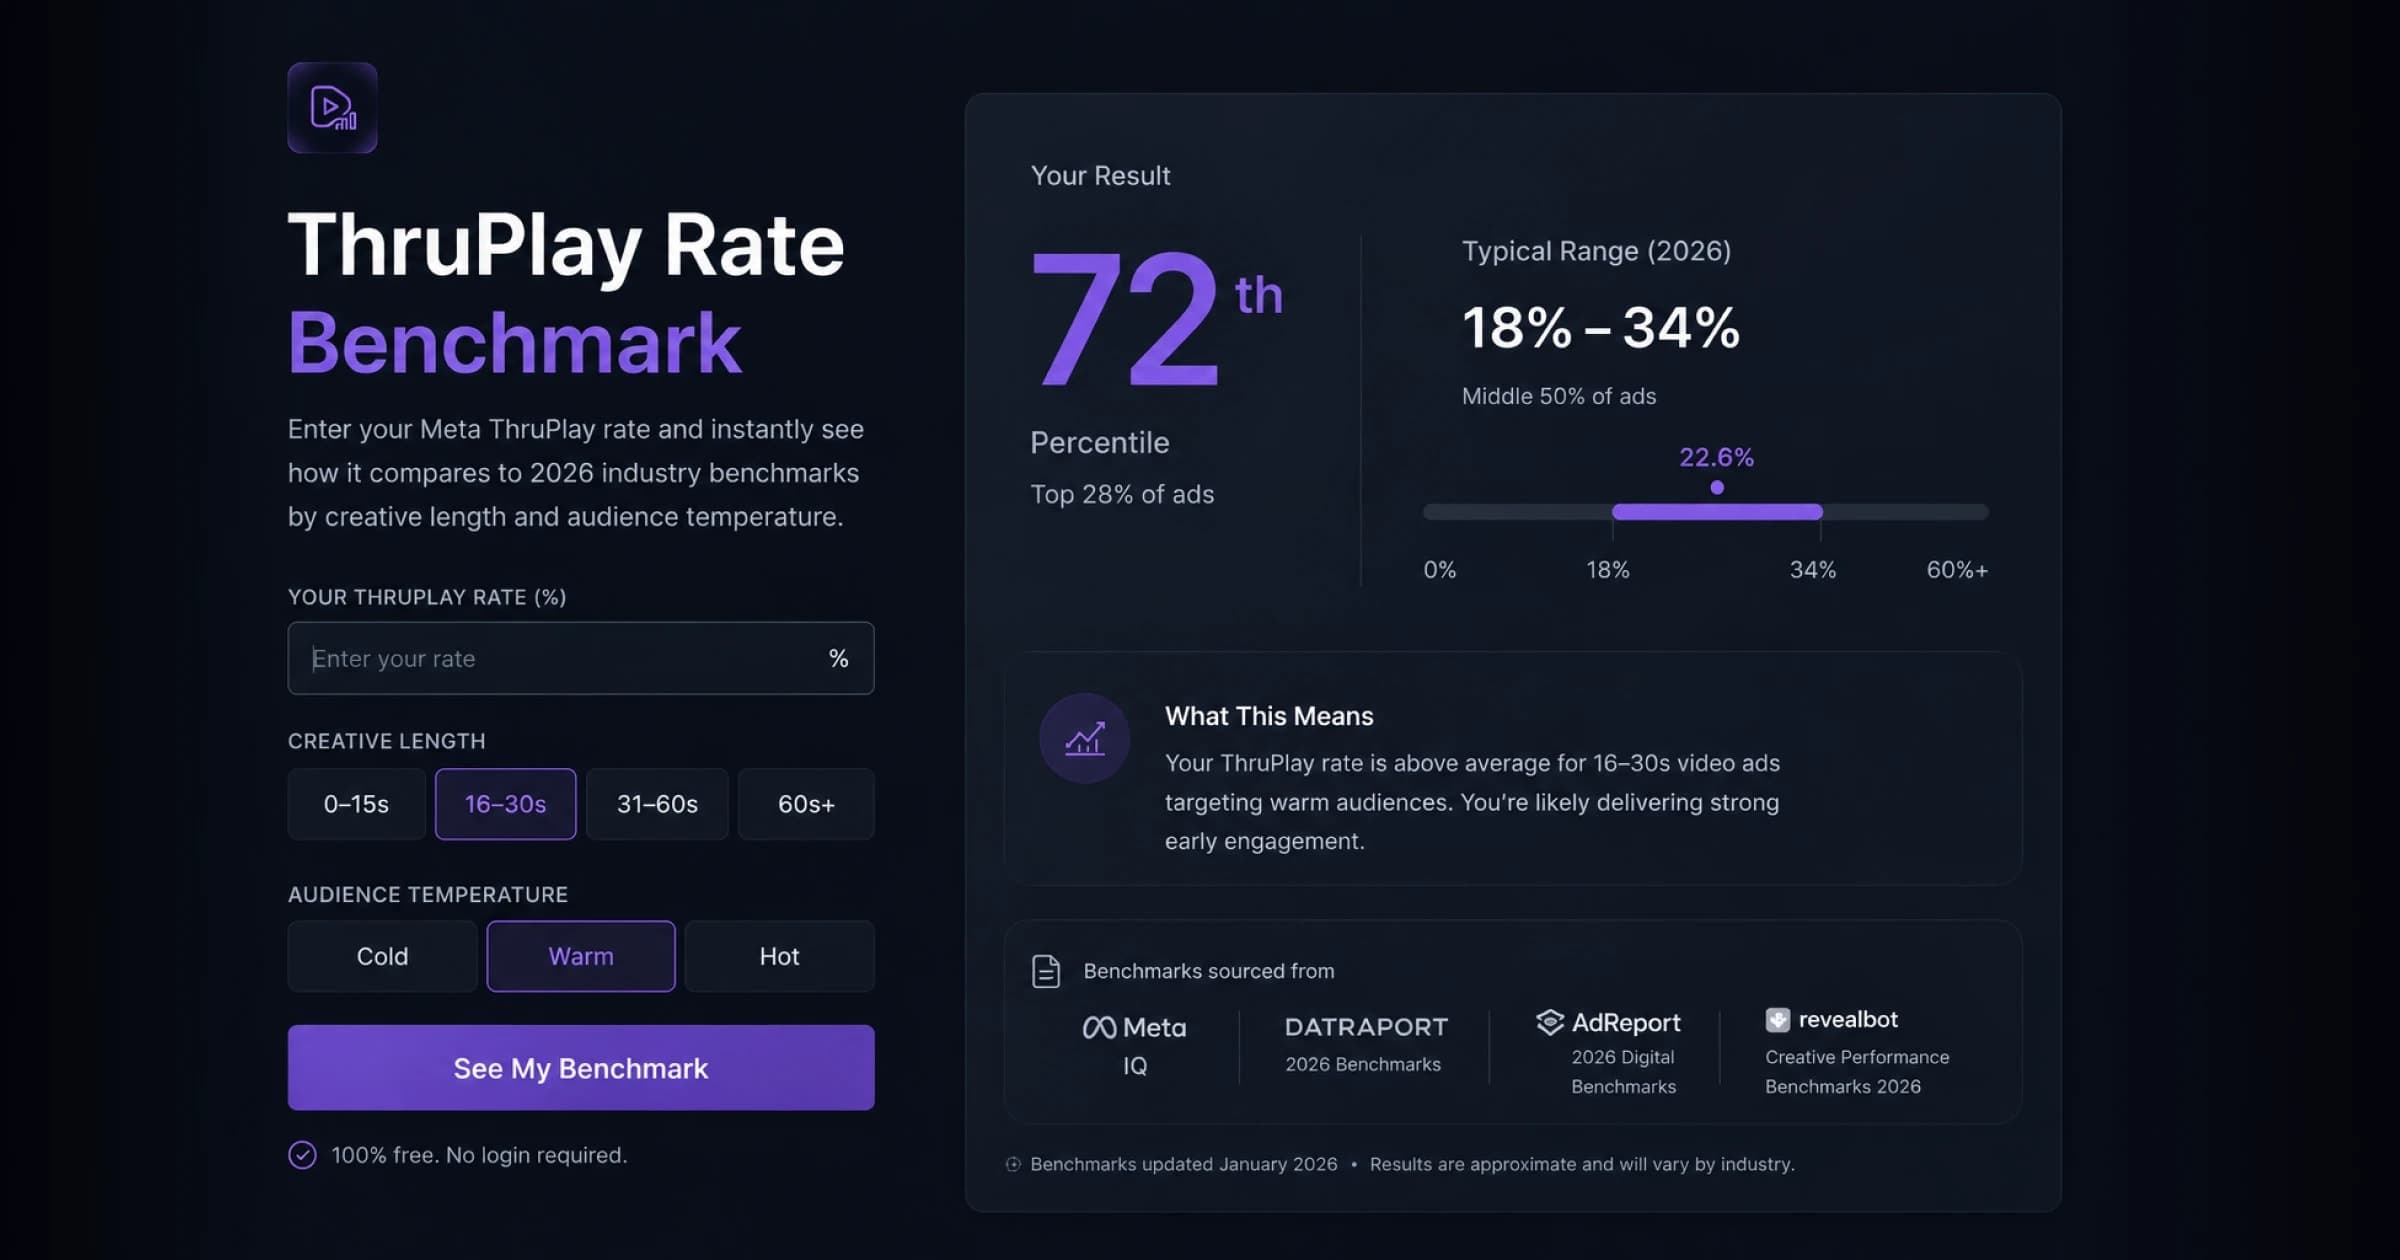
ThruPlay Rate Benchmark
Enter your Meta ThruPlay rate and instantly see how it compares to 2026 industry benchmarks by creative length and audience temperature. Free, no login — see where you land vs the cited typical range, with sources, and what your number means for creative performance.
Related Terms
Return on Ad Spend
Return on Ad Spend (ROAS) is a marketing performance metric that measures the revenue generated per dollar of advertising spend. Unlike ROI which considers all business costs, ROAS specifically evaluates advertising efficiency by comparing directly attributable revenue to ad spend. This metric is crucial for optimizing campaign performance, budget allocation, and overall marketing strategy.
Business-to-Business
Business-to-Business (B2B) refers to business conducted between companies, rather than between a company and individual consumers. B2B marketing focuses on the needs, interests, and challenges of individuals who are making purchases on behalf of their organization, rather than for personal use.
Customer Journey
The customer journey maps the comprehensive progression of interactions between a customer and brand across all channels, devices, and time periods. In modern digital marketing, it represents a non-linear, dynamic path encompassing both active and passive touchpoints - from initial brand discovery through consideration, purchase, and ongoing loyalty. This journey requires sophisticated cross-channel tracking, multi-touch attribution modeling, and strategic message orchestration to effectively guide users toward desired outcomes while delivering value at each stage.
