
The Creative Testing Framework: How to Run Rigorous Ad Tests
A complete framework for designing, running, and interpreting paid social creative tests — from hypothesis formation through statistical significance, with sample-size guidance and common pitfalls to avoid.
Quick takeaway
Test one variable at a time, pre-define your sample size, and separate statistical significance from business impact — that is how teams build repeatable creative knowledge instead of false winners.
Why You Need a Testing Framework
Most teams "test creative" without a framework — and learn the wrong lessons.
Creative testing without a framework produces false winners. Teams change multiple variables at once, read results after 48 hours, and declare victory on noise. The result: budgets shift to variants that regress to the mean within a week.
A rigorous framework isolates variables, pre-defines success criteria, and separates statistical significance from practical impact. The goal is not just finding a winner — it is building repeatable knowledge about what drives performance for your audience.
Typical test duration
5–7 days
Meta prospecting, 2–4 variants
Confidence target
95%
Standard marketing significance bar
Variables per test
1
Isolate hook, format, CTA, or length — not all at once
Step 1: Form a Testable Hypothesis
Every test starts with a specific, falsifiable prediction — not "let's see what works."
A strong hypothesis follows this template:
"If we change [single variable] from [A] to [B], then [metric] will improve by [expected magnitude] because [rationale]."
Examples:
- "If we change the hook from product demo to pain-point question, thumbstop rate will increase by 15% because our audience responds to problem-aware creative."
- "If we shorten the video from 30s to 15s, ThruPlay rate will increase because our retention data shows 40% drop-off after second 12."
Use the free A/B Test Tracker Template to log hypotheses, variants, and results across test cycles.
Step 2: Design a Controlled Test
Control everything except the one variable you are testing.
Pre-launch checklist
Only one variable differs between variants
Same aspect ratio, length, CTA, landing page, and audience
Equal budget allocation per variant (ABO)
Avoid CBO auto-optimization during the test window
Audience size is sufficient for your MDE
Narrow audiences need longer runtimes or higher spend
Conversion event is consistent
Do not switch optimization events mid-test
End date and sample size are pre-defined
Write them down before launch to prevent peeking bias
| Element | Keep constant | Vary in this test |
|---|---|---|
| Audience targeting | ✓ Same ad set | — |
| Budget per variant | ✓ Equal split | — |
| Landing page | ✓ Same URL | — |
| Video hook (first 3s) | — | ✓ Test variable |
| CTA text | ✓ Same CTA | — |
| Aspect ratio | ✓ Same format | — |
Step 3: Calculate Sample Size
Know how many conversions you need before you start spending.
Sample size depends on three inputs: your baseline conversion rate, the minimum detectable effect (MDE) you care about, and your confidence level. A test designed to detect a 5% relative lift needs far more data than one targeting a 50% relative lift.
Rule of thumb for Meta prospecting: plan for at least 50–100 conversions per variant for conversion-optimized tests, or 5,000–10,000 impressions per variant for upper-funnel metrics like thumbstop and hold rate.
Free Tool
Creative Testing Calculator
Calculate required sample size and test duration based on your baseline rate and minimum detectable effect.
Free Tool
A/B Test Significance Calculator
Check whether your results reached statistical significance at 90%, 95%, or 99% confidence.
Step 4: Interpret Results Without False Positives
Statistical significance is necessary but not sufficient for declaring a winner.
- 1
Check statistical significance
Use a significance calculator with your variant sample sizes and conversion rates. Do not eyeball a 12% vs 15% CTR difference without checking whether the sample supports it.
- 2
Assess practical significance
A statistically significant 2% CPA improvement may not justify rebuilding all creative. Ask: "Is this lift large enough to change our production workflow?"
- 3
Segment before concluding
Check mobile vs desktop, new vs returning, and placement breakdowns. A variant that wins overall but loses on mobile may not be a true winner for your primary audience.
- 4
Document and iterate
Record the hypothesis, result, and learning in your test tracker. The next test should build on confirmed insights, not restart from zero.
Key Takeaways
- One variable per test — always
- Pre-define sample size and end date before launch
- Statistical significance ≠ business significance
- Document learnings to compound knowledge across sprints
Frequently Asked Questions
Related Tools & Guides

Creative Testing Budget Calculator
Plan your creative testing budget effectively with our comprehensive calculator. Get expert recommendations for test duration, sample size, and budget allocation to ensure statistically significant results.

A/B Test Significance Calculator
Make data-driven decisions with our A/B test significance calculator. Analyze test results with statistical rigor, determine confidence levels, and get actionable recommendations for test duration and sample size requirements.
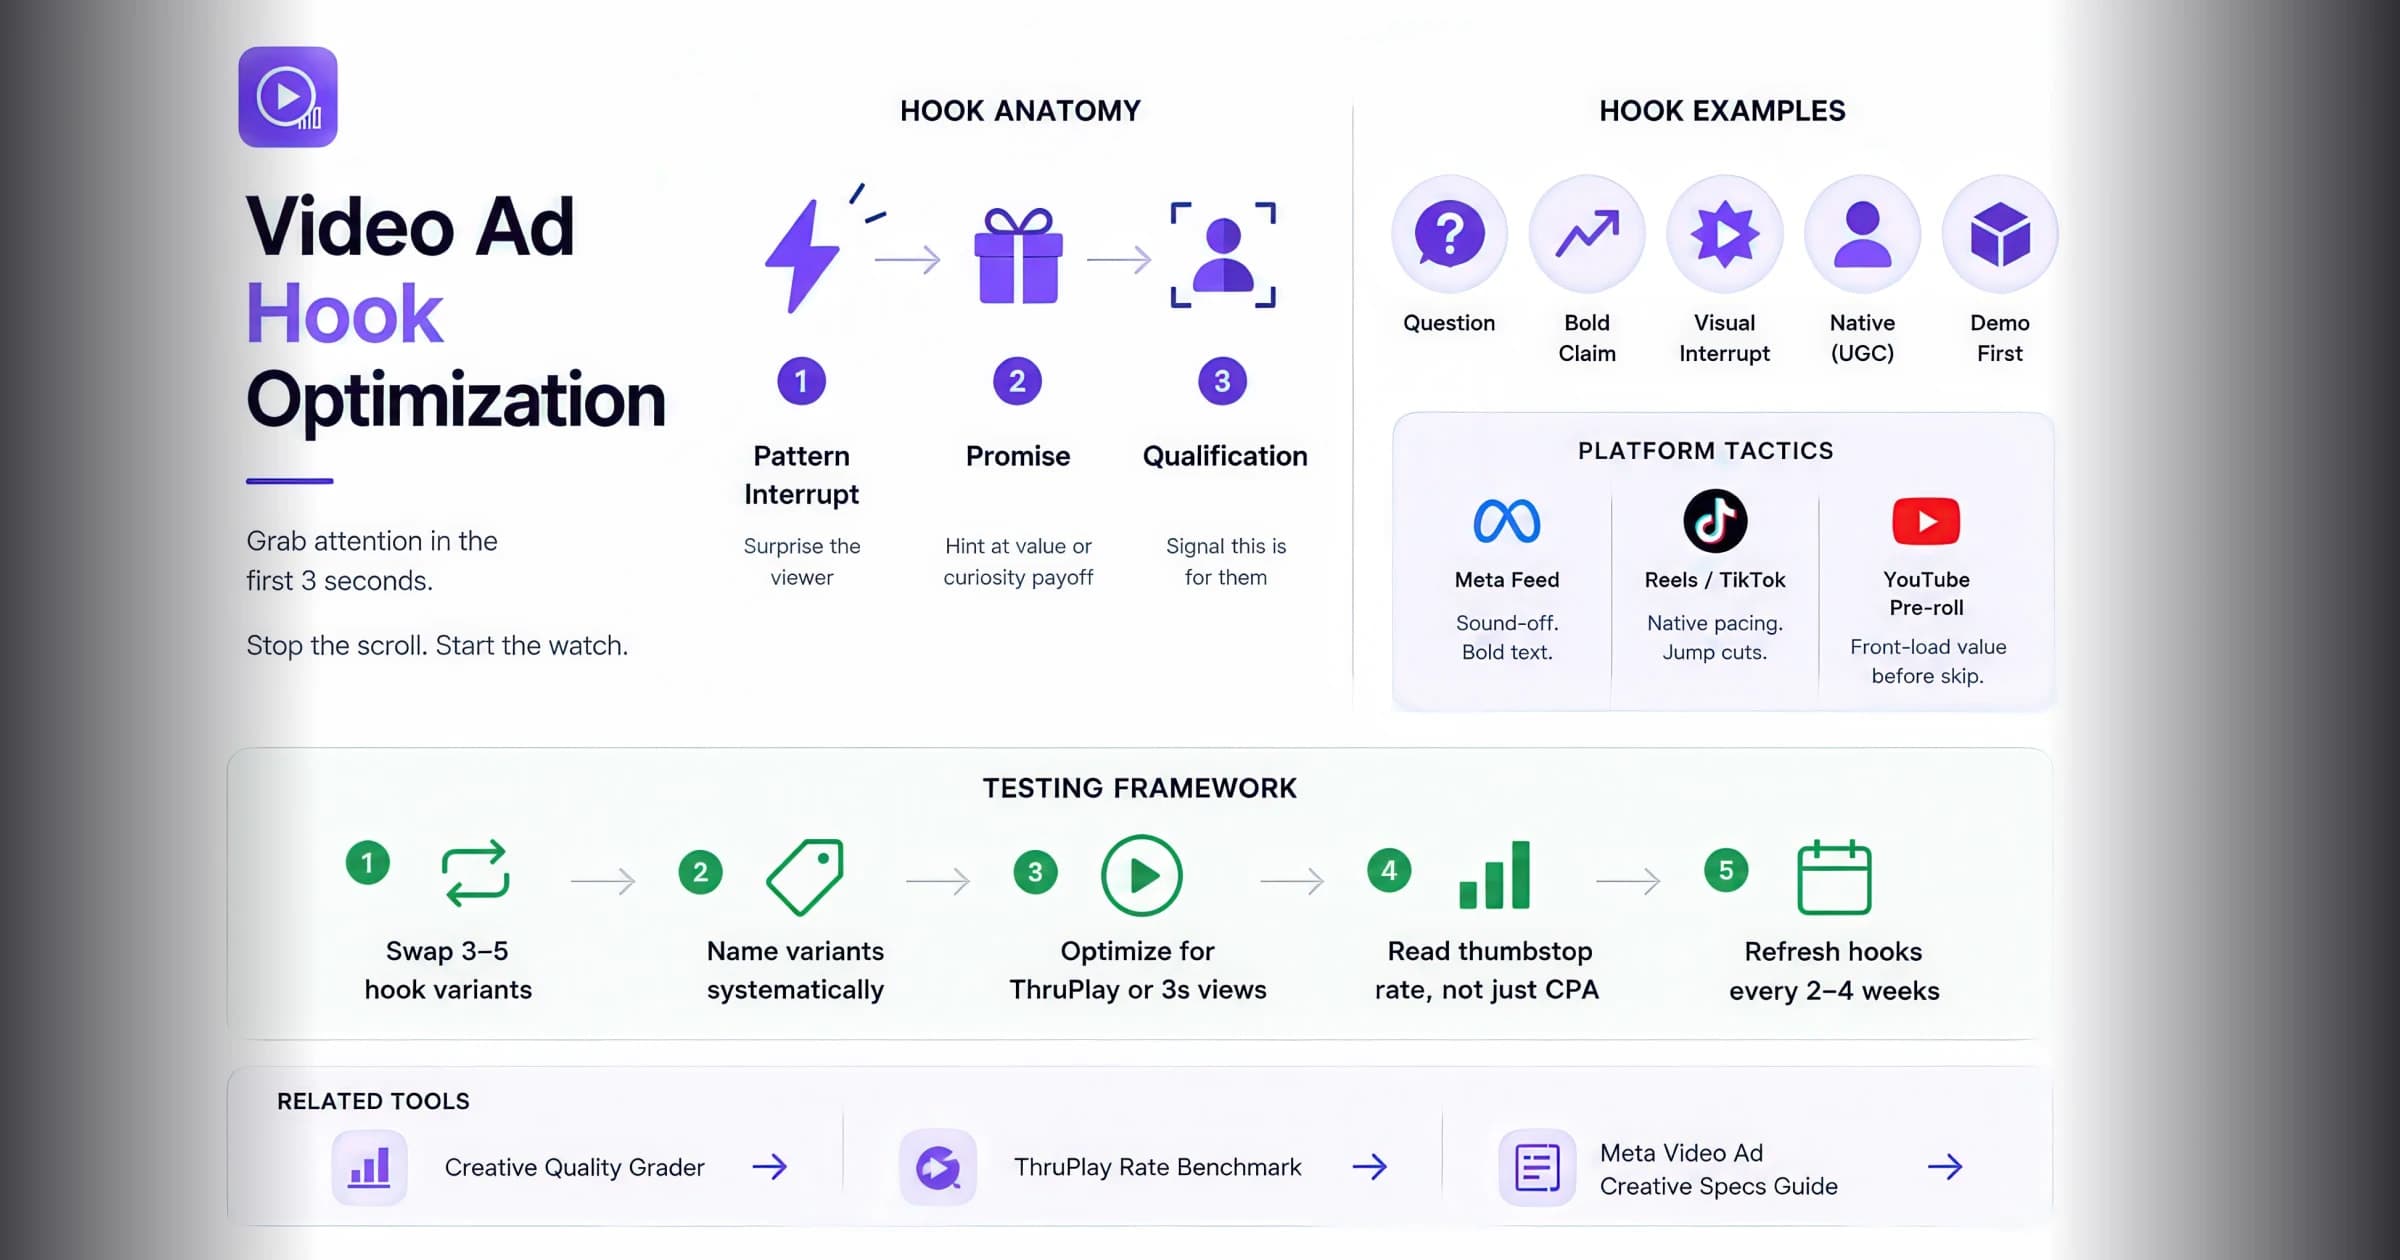
Video Ad Hook Optimization: Win the First 3 Seconds
Master the anatomy of high-performing video ad hooks — pattern interrupts, thumbstop tactics, platform-specific formats, and a repeatable testing framework for the first 3 seconds of your creative.