View Through Rate
Share of ad impressions that become platform-counted views — VTR = (counted views ÷ impressions) × 100; in attribution contexts, the share of impressions that led to post-view conversions.
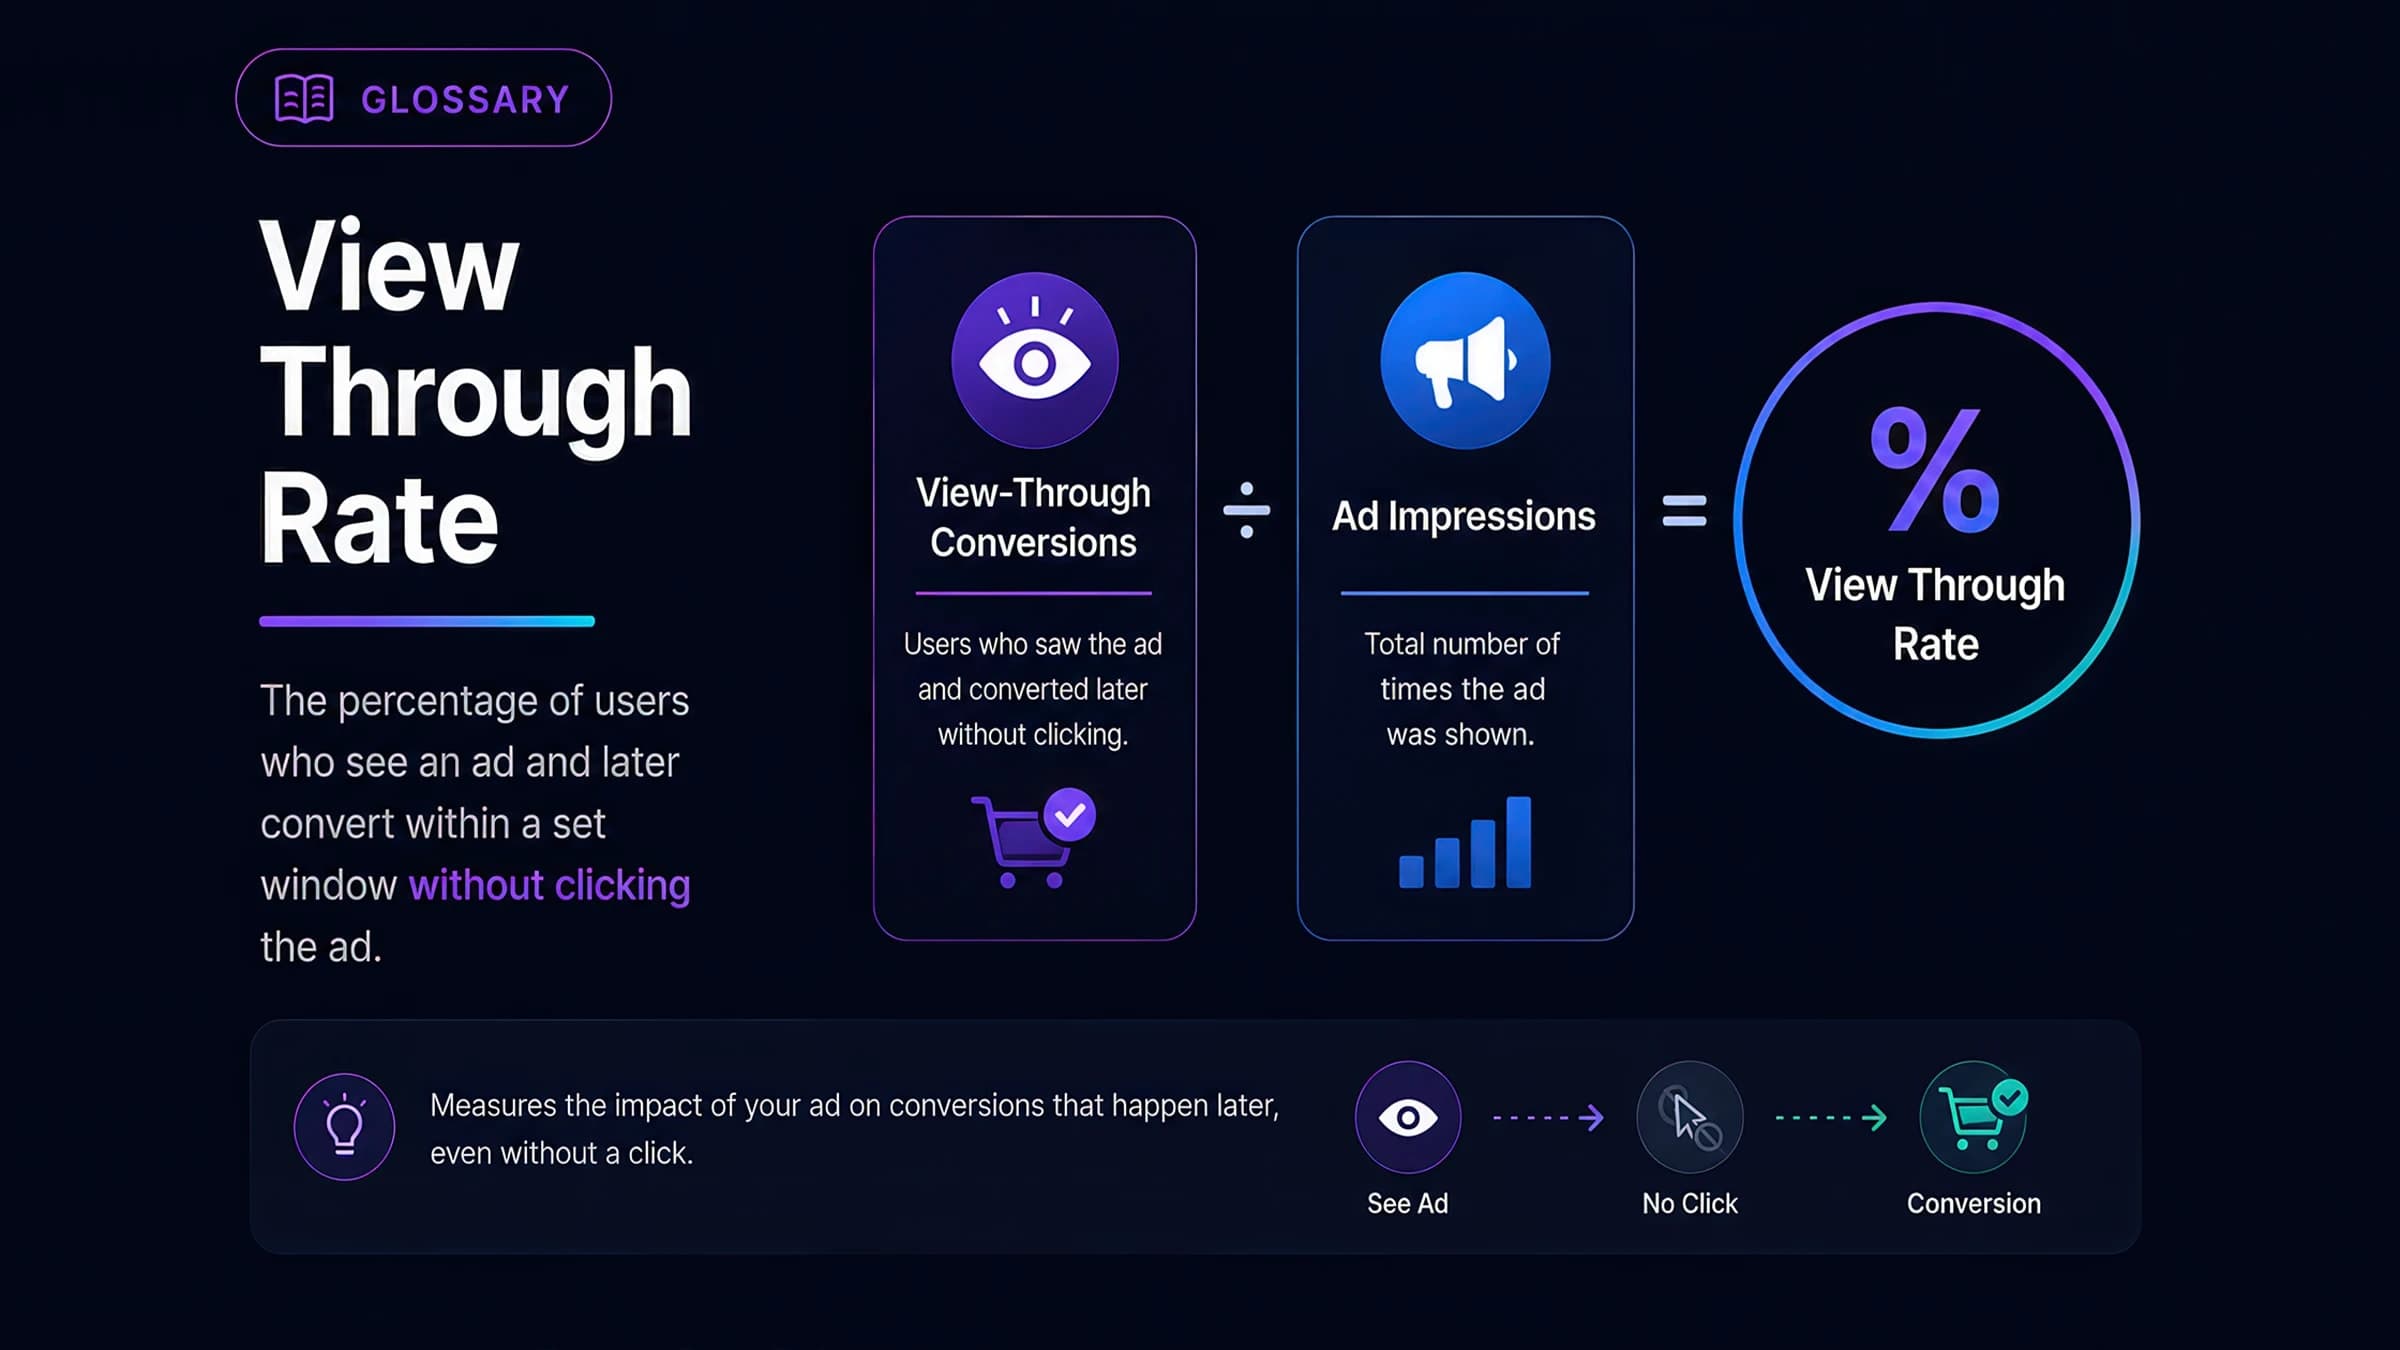
Definition
View Through Rate (VTR) most commonly measures the share of ad impressions that become platform-counted views: VTR = (counted views ÷ impressions) × 100, with YouTube TrueView counting a view at 30 seconds or completion. In attribution contexts, VTR instead means the share of impressions that led to a conversion without a click. Always confirm which meaning a report uses.
Examples
160,000 counted views from 500,000 impressions is a 32% VTR in the view-rate sense
In the attribution sense, a 0.1% VTR means 1 in 1000 impressions led to a post-view conversion
B2B campaigns may use 30-day view-through windows for the attribution meaning
Calculation
How to Calculate
Divide platform-counted views by total impressions and multiply by 100 — this is the common view-rate meaning (YouTube TrueView counts a view at 30 seconds or completion). VTR's second, attribution meaning swaps the numerator: VTR = (view-through conversions ÷ impressions) × 100, counting users who saw the ad without clicking and converted within the attribution window. The two numbers differ by orders of magnitude, so always confirm which meaning a report uses.
Formula
VTR = (Counted Views / Total Ad Impressions) × 100Unit of Measurement
%
Operation Type
divide
Formula Variables
Industry Benchmarks for View Through Rate
Typical performance ranges by industry segment. Benchmarks vary by platform, audience maturity, and attribution window — treat these as starting points, not targets.
YouTube TrueView in-stream (all industries)
- Typical range
- 25% – 40%
- Median
- 31.9%
Industry-wide TrueView view rate; above 35% is strong, above 40% is top quartile.
YouTube TrueView in-stream, short-form creative (<30s)
- Typical range
- 15% – 30%
- Median
- 22%
Shorter hooks drive higher view rates because the 30s threshold becomes 'watch to completion.'
YouTube TrueView in-stream, long-form (60s+)
- Typical range
- 2% – 10%
- Median
- 6%
Long creative makes the 30-second view bar harder to clear before skip-button availability at 5s.
YouTube Shorts ads (vertical, ≤60s)
- Typical range
- 35% – 55%
- Median
- ~45%
Vertical, sound-on, swipe-native — higher view rate than skippable in-stream; CTR ~1.24% vs ~0.65% in-stream.
YouTube bumpers (6s non-skippable)
- Typical range
- N/A (no VTR reported)
- Median
- —
Bumpers don't generate TrueView 'views' because they can't be skipped; use CPM and completion instead.
TikTok in-feed (2s view definition)
- Typical range
- 60% – 80%
- Median
- ~70%
TikTok counts a 'view' at 2 seconds, so VTR-equivalents look very high and aren't comparable to YouTube.
Sources: Google Ads / Store Growers 2026, Mutesix, Future Digital VTR Guide 2025, OwlClaw YouTube Benchmarks 2026, Store Growers, Google Ads Help, AdWiseCircle 2025, WebFX TikTok Benchmarks 2026, AdBacklog 2025
Comparison
Related Metrics
Return on Ad Spend (ROAS)
Return on Ad Spend (ROAS) is a marketing performance metric that measures the revenue generated per dollar of advertising spend. Unlike ROI which considers all business costs, ROAS specifically evaluates advertising efficiency by comparing directly attributable revenue to ad spend. This metric is crucial for optimizing campaign performance, budget allocation, and overall marketing strategy.
Click-Through Rate (CTR)
Click-Through Rate (CTR) measures the ratio of clicks to impressions for a digital advertisement, email, or other clickable content. It's a fundamental metric for evaluating creative relevance, audience targeting quality, and overall ad effectiveness in driving user engagement. CTR varies significantly by format, placement, and channel, making context crucial for performance evaluation.
Cost Per Action (CPA)
Cost Per Action (CPA) measures the average cost required to generate a specific user action or micro-conversion, such as form submissions, email signups, content downloads, or other engagement events. Unlike Cost Per Acquisition which focuses on customer acquisition, CPA tracks the cost efficiency of driving specific engagement milestones that may occur earlier in the customer journey.
Conversion Rate
Conversion rate measures the percentage of users who complete a defined conversion action relative to the total number who had the opportunity to convert. This metric evaluates the effectiveness of marketing efforts, user experience, and overall funnel efficiency in driving desired outcomes. Conversion actions can range from purchases and form submissions to content downloads and subscription signups.
Ad Frequency
Ad frequency measures the average number of times a unique user is exposed to a specific advertisement during a campaign period. This metric is crucial for managing ad fatigue, optimizing reach vs. repetition, and ensuring effective message delivery without oversaturation. Frequency management varies by campaign objective, creative format, and audience type.
Cost Per Mille (CPM)
Cost Per Mille (CPM) represents the cost an advertiser pays to deliver 1,000 ad impressions to their target audience. This metric is fundamental for media planning and buying, enabling comparison of advertising costs across different platforms, formats, and audience segments. CPM pricing reflects placement quality, audience targeting precision, and market demand.
Cost Per Click (CPC)
Cost Per Click (CPC) represents the average cost an advertiser pays for each click on their advertisement. In auction-based platforms, actual CPC is determined through a combination of bid amount, quality score, and competition. This metric is fundamental for measuring traffic acquisition efficiency and comparing costs across channels and campaigns.
Pay-Per-Click (PPC)
Pay-Per-Click is an advertising model and auction system where advertisers bid for ad placement and pay only when users click their ads. The actual cost per click is determined through a real-time auction that weighs bid amounts against quality signals — expected click-through rate, ad relevance, and landing page experience — so a highly relevant ad can win a better position at a lower price than a less relevant, higher-bidding competitor. PPC spans search (Google Ads, Microsoft Advertising), social (Meta, LinkedIn, TikTok), and display or shopping formats, and aligns cost with engagement rather than mere exposure, which makes it inherently measurable and accountable to downstream conversions and ROAS.
Reach
Reach measures the total number of unique users who have been exposed to an advertisement at least once during a campaign period. This metric is fundamental for understanding campaign scale, audience penetration, and the efficiency of media spend in accessing target audiences. Reach can be measured at various levels including campaign, platform, and total brand reach.
Engagement Rate
Engagement rate measures the share of an audience that interacted with content, calculated as (total engagements ÷ followers, reach, or impressions) × 100. Engagements typically include clicks, likes, comments, shares, saves, and reactions. The denominator definition varies by platform and report — always confirm which one a benchmark uses before comparing numbers.
Video Completion Rate (VCR)
Video Completion Rate measures the percentage of video ad impressions that are watched to 100% completion. This metric helps evaluate creative engagement, message delivery effectiveness, and audience targeting accuracy while accounting for video length and placement quality. VCR is particularly important for brand messaging where full creative viewing is crucial.
Cost Per View (CPV)
Cost Per View measures the average cost of a qualified video view, with platform-specific definitions of what constitutes a billable view. Common view criteria include watching 2-30 seconds, 50% of video in view for 2 continuous seconds, or user-initiated plays. This metric helps evaluate video ad spending efficiency and compare performance across platforms, formats, and campaigns.
Cost Per Completed View (CPCV)
Cost Per Completed View measures the average cost incurred for each video ad watched to 100% completion — total video spend divided by completed views. It is particularly relevant for brand and storytelling campaigns where the payoff — the logo, offer, or emotional beat — usually lands at the end, so a partial view delivers little value. On some platforms CPCV is a buying model where you're charged only when a view completes; more often it's an effective metric calculated over a CPM or CPV buy, in which case impressions and partial views still consume budget and CPCV simply expresses what each completion cost. Either way it isolates the cost of complete message delivery, complementing exposure metrics like CPM (which prices impressions regardless of watch time) and CPV (which counts partial views).
Blended Customer Acquisition Cost
Blended Customer Acquisition Cost (Blended CAC) is the total marketing investment divided by the total number of new customers acquired across all channels in a given period, regardless of which channel or touchpoint gets the attribution credit. Unlike platform-reported CAC — which only sees customers a single ad platform claims it acquired, often inflated by click-attribution and view-through windows — Blended CAC pulls the spend numerator from the finance ledger and the customer denominator from the order/CRM database, then divides. The result is a single, board-room friendly number that cannot be gamed by attribution settings. The metric became a staple of the DTC ecommerce operator community in 2021–2023, popularized by analytics platforms like Triple Whale, Northbeam, Polar Analytics and the agency Common Thread Collective. Its rise coincided with Apple's App Tracking Transparency (iOS 14.5) breaking deterministic platform attribution: when Meta and Google could no longer reliably count their own conversions, operators reverted to dividing aggregate spend by aggregate new customers as a ground-truth sanity check. Blended CAC is now the headline efficiency metric in many DTC P&L reviews, sitting alongside MER (Marketing Efficiency Ratio) and nCAC (new-customer acquisition cost). Definitional scope varies. Strict Blended CAC includes only paid media spend (Meta, Google, TikTok, etc.). Broad Blended CAC — sometimes called 'fully-loaded CAC' — adds agency fees, creative production, marketing tools, influencer payouts, affiliate commissions and even allocated marketing salaries. Operators should pick one definition and apply it consistently quarter over quarter rather than switching mid-stream.
Marketing Efficiency Ratio (MER)
Marketing Efficiency Ratio measures the overall effectiveness of marketing spend by comparing total revenue to total marketing costs. It provides a holistic view of marketing performance across all channels and customer types, including both direct and indirect revenue attribution. Also known as 'blended MER' since it considers all revenue rather than just attributed revenue.
Attributed Marketing Efficiency Ratio (aMER)
Attributed Marketing Efficiency Ratio measures the efficiency of paid marketing efforts by comparing revenue directly attributed to paid channels against total marketing spend. This metric helps isolate the performance of paid marketing initiatives from organic revenue.
New Marketing Efficiency Ratio (nMER)
New Marketing Efficiency Ratio (nMER) measures acquisition efficiency by dividing revenue from first-time customers by total marketing spend. Popularized by Triple Whale and the modern DTC measurement stack, it answers the question blended MER cannot: how efficiently is the marketing program buying new customers once repeat and subscription revenue are stripped out of the numerator. Unlike ROAS, which counts only the revenue an attribution model credits to a single channel against that channel's ad spend, nMER is attribution-agnostic — all first-order revenue over all marketing cost. And where nCAC prices each new customer in dollars, nMER expresses the same acquisition economics as a revenue multiple. For paid-social advertisers it is the natural guardrail for prospecting budgets: a healthy retention engine can hold blended MER steady for months while cold-audience acquisition quietly becomes unprofitable, and nMER is the number that exposes that decay early.
Thumbstop Rate
Thumbstop Rate measures the effectiveness of creative in capturing attention by tracking the percentage of users who stop scrolling to engage with the content in their feed for a meaningful duration, typically 2-6 seconds depending on the platform.
Thumbstop Click Rate
Thumbstop Click Rate measures the effectiveness of creative in driving action by tracking the percentage of users who click on content after stopping their scroll for a meaningful duration. This metric helps evaluate both attention-grabbing and conversion capabilities of creative, providing insight into content's ability to not just capture but convert attention.
ThruPlay
ThruPlay is Meta's standard video-view event, counted when a viewer watches a video to 15 seconds — or to completion if the video is shorter. It is both a reported metric and a biddable optimization/billing event, and it replaced Meta's retired 10-second video view. ThruPlays ÷ video plays gives the ThruPlay Rate; spend ÷ ThruPlays gives Cost Per ThruPlay. The term is Meta-specific.
ThruPlay Rate
ThruPlay Rate measures the percentage of video plays where users watch either the entire video (for videos under 15 seconds) or at least 15 seconds (for longer videos). This is the denominator Meta reports against; on Meta, autoplay keeps video plays ≈ impressions. The metric evaluates content's ability to maintain viewer attention and deliver complete messages, particularly important for platforms like Meta and TikTok.
Hold Rate
Hold Rate measures how well a video ad retains the viewers it has already hooked — the share of 3-second video views that go on to reach 15 seconds (or completion for shorter videos). Where Hook Rate (Thumbstop Rate) judges the open, Hold Rate judges the middle: it isolates whether the body of the ad earns continued attention after the scroll-stopping first frames, normalized to the audience that actually started watching rather than to total impressions.
Cost Per ThruPlay
Cost Per ThruPlay measures the average cost to achieve a ThruPlay, which is either a complete video view for content under 15 seconds or a 15-second watch for longer videos. This metric helps evaluate the efficiency of video ad spending in delivering complete messages to viewers.
Impressions
Impressions measure the total number of times an advertisement is shown to users, regardless of whether they interact with it. Each time an ad appears on a screen counts as one impression, though viewability standards may require minimum exposure duration or percentage in view to count as a valid impression.
Share of Voice (SOV)
Share of Voice quantifies a brand's presence and visibility in the market compared to competitors or total market activity. It measures relative market presence across paid advertising impressions, organic social media engagement, PR mentions, and other trackable communications channels. SOV helps evaluate competitive position and communication effectiveness.
Churn Rate (CR)
Churn rate measures the proportion of customers who discontinue their relationship with a company during a specific timeframe. For subscription businesses, this means cancellations or non-renewals. For non-subscription businesses, churn is often defined as no purchase activity within a set period. It's a critical metric for evaluating customer retention and business health.
Customer Retention Rate (CRR)
Customer Retention Rate measures the proportion of customers who remain active with a company during a specific timeframe. For subscription businesses, this means continued subscriptions. For non-subscription businesses, retention is often defined as repeat purchase activity within a set period. It's a key metric for evaluating customer loyalty, satisfaction, and the effectiveness of retention strategies.
Return on Investment (ROI)
Return on Investment measures the profitability of an investment by comparing the net profit (revenue minus all costs) to the total investment cost. In marketing, it considers all costs including media spend, creative production, technology, overhead, and operational expenses, making it a more comprehensive metric than ROAS which focuses specifically on ad spend.
Moving Average
A moving average is a statistical calculation that creates a series of averages from different subsets of data over time. By recalculating the average over a sliding window — commonly 7 or 28 days for ad data — it separates trend from noise, smoothing out short-term fluctuations and random outliers in metrics like CPC, CTR, or ROAS. Daily platform numbers are often too volatile to act on directly; the moving average is the version you can actually make decisions on.
Statistical Significance
Statistical significance indicates whether an observed difference between variants in an experiment is likely to be due to random chance or represents a genuine effect. In advertising, it helps determine if differences in key metrics like CTR, conversion rate, or ROAS between ad variants or campaigns represent real performance differences rather than random fluctuations. This is crucial for making data-driven optimization decisions and avoiding false conclusions based on temporary variations.
Confidence Interval
A confidence interval provides a range of values that likely contains the true value of a metric, given a certain confidence level. In digital advertising, it helps marketers understand the reliability of their performance measurements and make more informed decisions about campaign optimization. Wider intervals suggest more uncertainty, while narrower intervals indicate more precise estimates of true performance.
Margin of Error
Margin of error represents the maximum expected difference between a sample-based estimate and the true population value, given a specific confidence level. In advertising, it helps quantify the reliability of metrics and determines required sample sizes for meaningful testing.
Sample Size
Sample size refers to the number of observations or data points collected in a sample, and is a crucial factor in determining the precision of statistical estimates. In advertising, it directly impacts the confidence, reliability, and validity of metrics such as conversion rates, click-through rates, and return on ad spend (ROAS). The larger the sample size, the more reliable the results, as smaller samples can lead to more variability and less confidence in the conclusions drawn from the data.
Variance
Variance is the average of the squared differences between each data point and the mean — the foundational measure of how spread out a metric's values are. In digital advertising, variance quantifies the volatility of metrics like daily CPA, ROAS, or CTR: a campaign averaging a $50 CPA with low variance delivers predictable results, while the same average with high variance swings between cheap and expensive days. Because the differences are squared, variance is expressed in squared units, so practitioners usually report its square root — the standard deviation — while variance itself powers significance tests and sample-size math.
Population Mean
The population mean is the average value of a variable calculated using all members of a population, rather than just a sample. In digital advertising, it represents the true average value of metrics like conversion rate, CTR, or CPC across the entire audience or campaign. Unlike sample means which contain sampling error, the population mean is the actual parameter being estimated in statistical analysis, though it's often impossible to measure directly due to resource constraints.
Standard Deviation
Standard deviation quantifies the amount of variation in advertising metrics, helping marketers understand performance volatility and set appropriate monitoring thresholds. It is the square root of the variance, expressed in the same units as the metric itself — for roughly normal data, about 68% of observations fall within one standard deviation of the mean and about 95% within two. In digital advertising, it's crucial for identifying abnormal performance and creating optimization rules that account for natural fluctuations.
Activation Rate
Activation Rate is the percentage of new users or sign-ups who complete a defined activation event — the moment they first experience the product's core value (the 'aha' moment). It is the second stage of the pirate-metrics (AARRR) funnel after acquisition, and the most important early predictor of retention and conversion in product-led businesses, because users who never reach first value rarely come back or pay.
How AdSights helps you track View Through Rate
AdSights ties view-through performance back to the specific creative ingredients that produce a counted view. By scoring every variant's opening hook, thumbnail composition, on-screen text, and first-three-second pacing alongside platform-reported VTR, AdSights identifies which creative patterns earn the skip-resistant attention that drives view rate up — and which openers are leaking impressions before the 30-second threshold. Teams use this to brief new YouTube creative around proven hook archetypes, A/B opening frames with intent, and stop fatigued openers from dragging down a campaign's view rate and inflating effective CPV.
Want AI to track View Through Rate across your creative automatically?
Request early accessSupplemental Resources
- 📚Video Drop-off Rate Calculator
VTR is mechanically capped by where viewers drop off before the platform's view threshold (30s on YouTube TrueView). This calculator maps the retention curve so you can see which viewers fell short.
AdSights Tool - 📚How to Calculate VCR, ThruPlay & VTR
Side-by-side formulas for VCR, ThruPlay, and VTR — worked examples for both VTR meanings and when to use each metric.
AdSights Article
Frequently asked questions
Common questions about View Through Rate, answered.
