Stay Updated
Get the latest insights on creative testing and ad optimization delivered to your inbox.
Get the latest insights on creative testing and ad optimization delivered to your inbox.

Continue reading about this topic with these recommended articles.
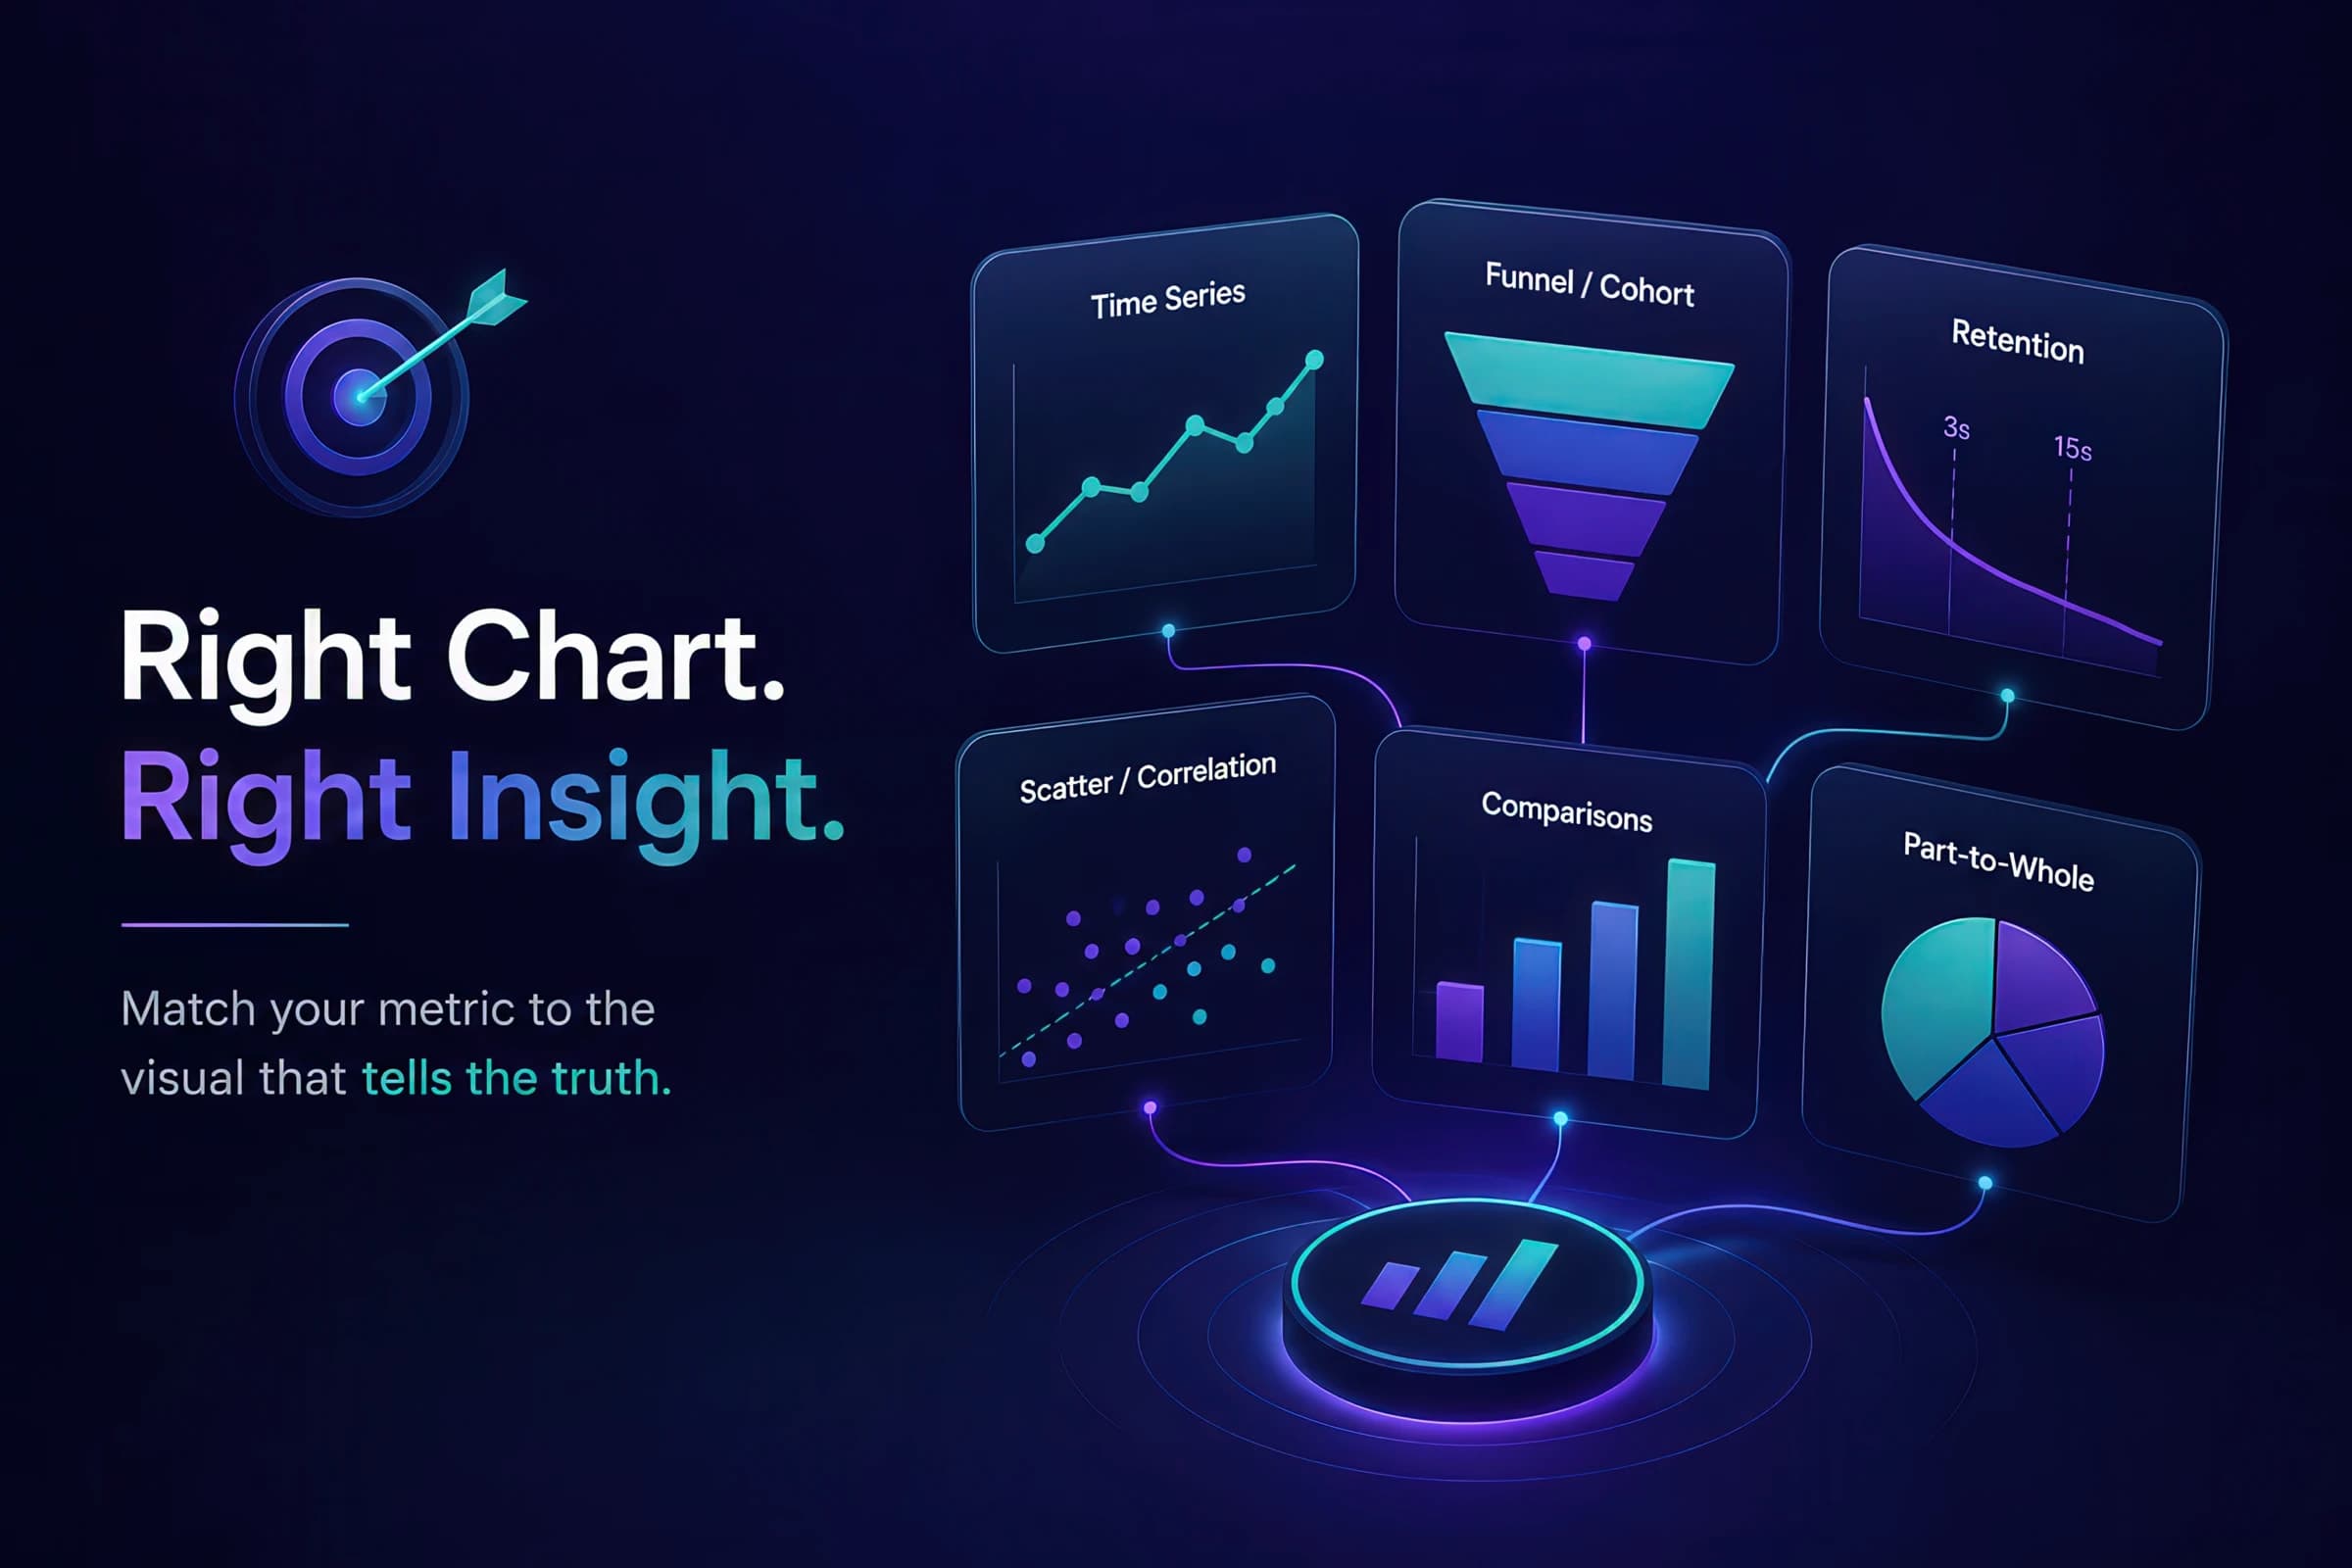
Choose the right chart for ROAS trends, funnel drop-off, creative tests, and cohort retention. Interactive examples, research citations, and the dashboard mistakes that hide signal.
AI-powered marketing tools
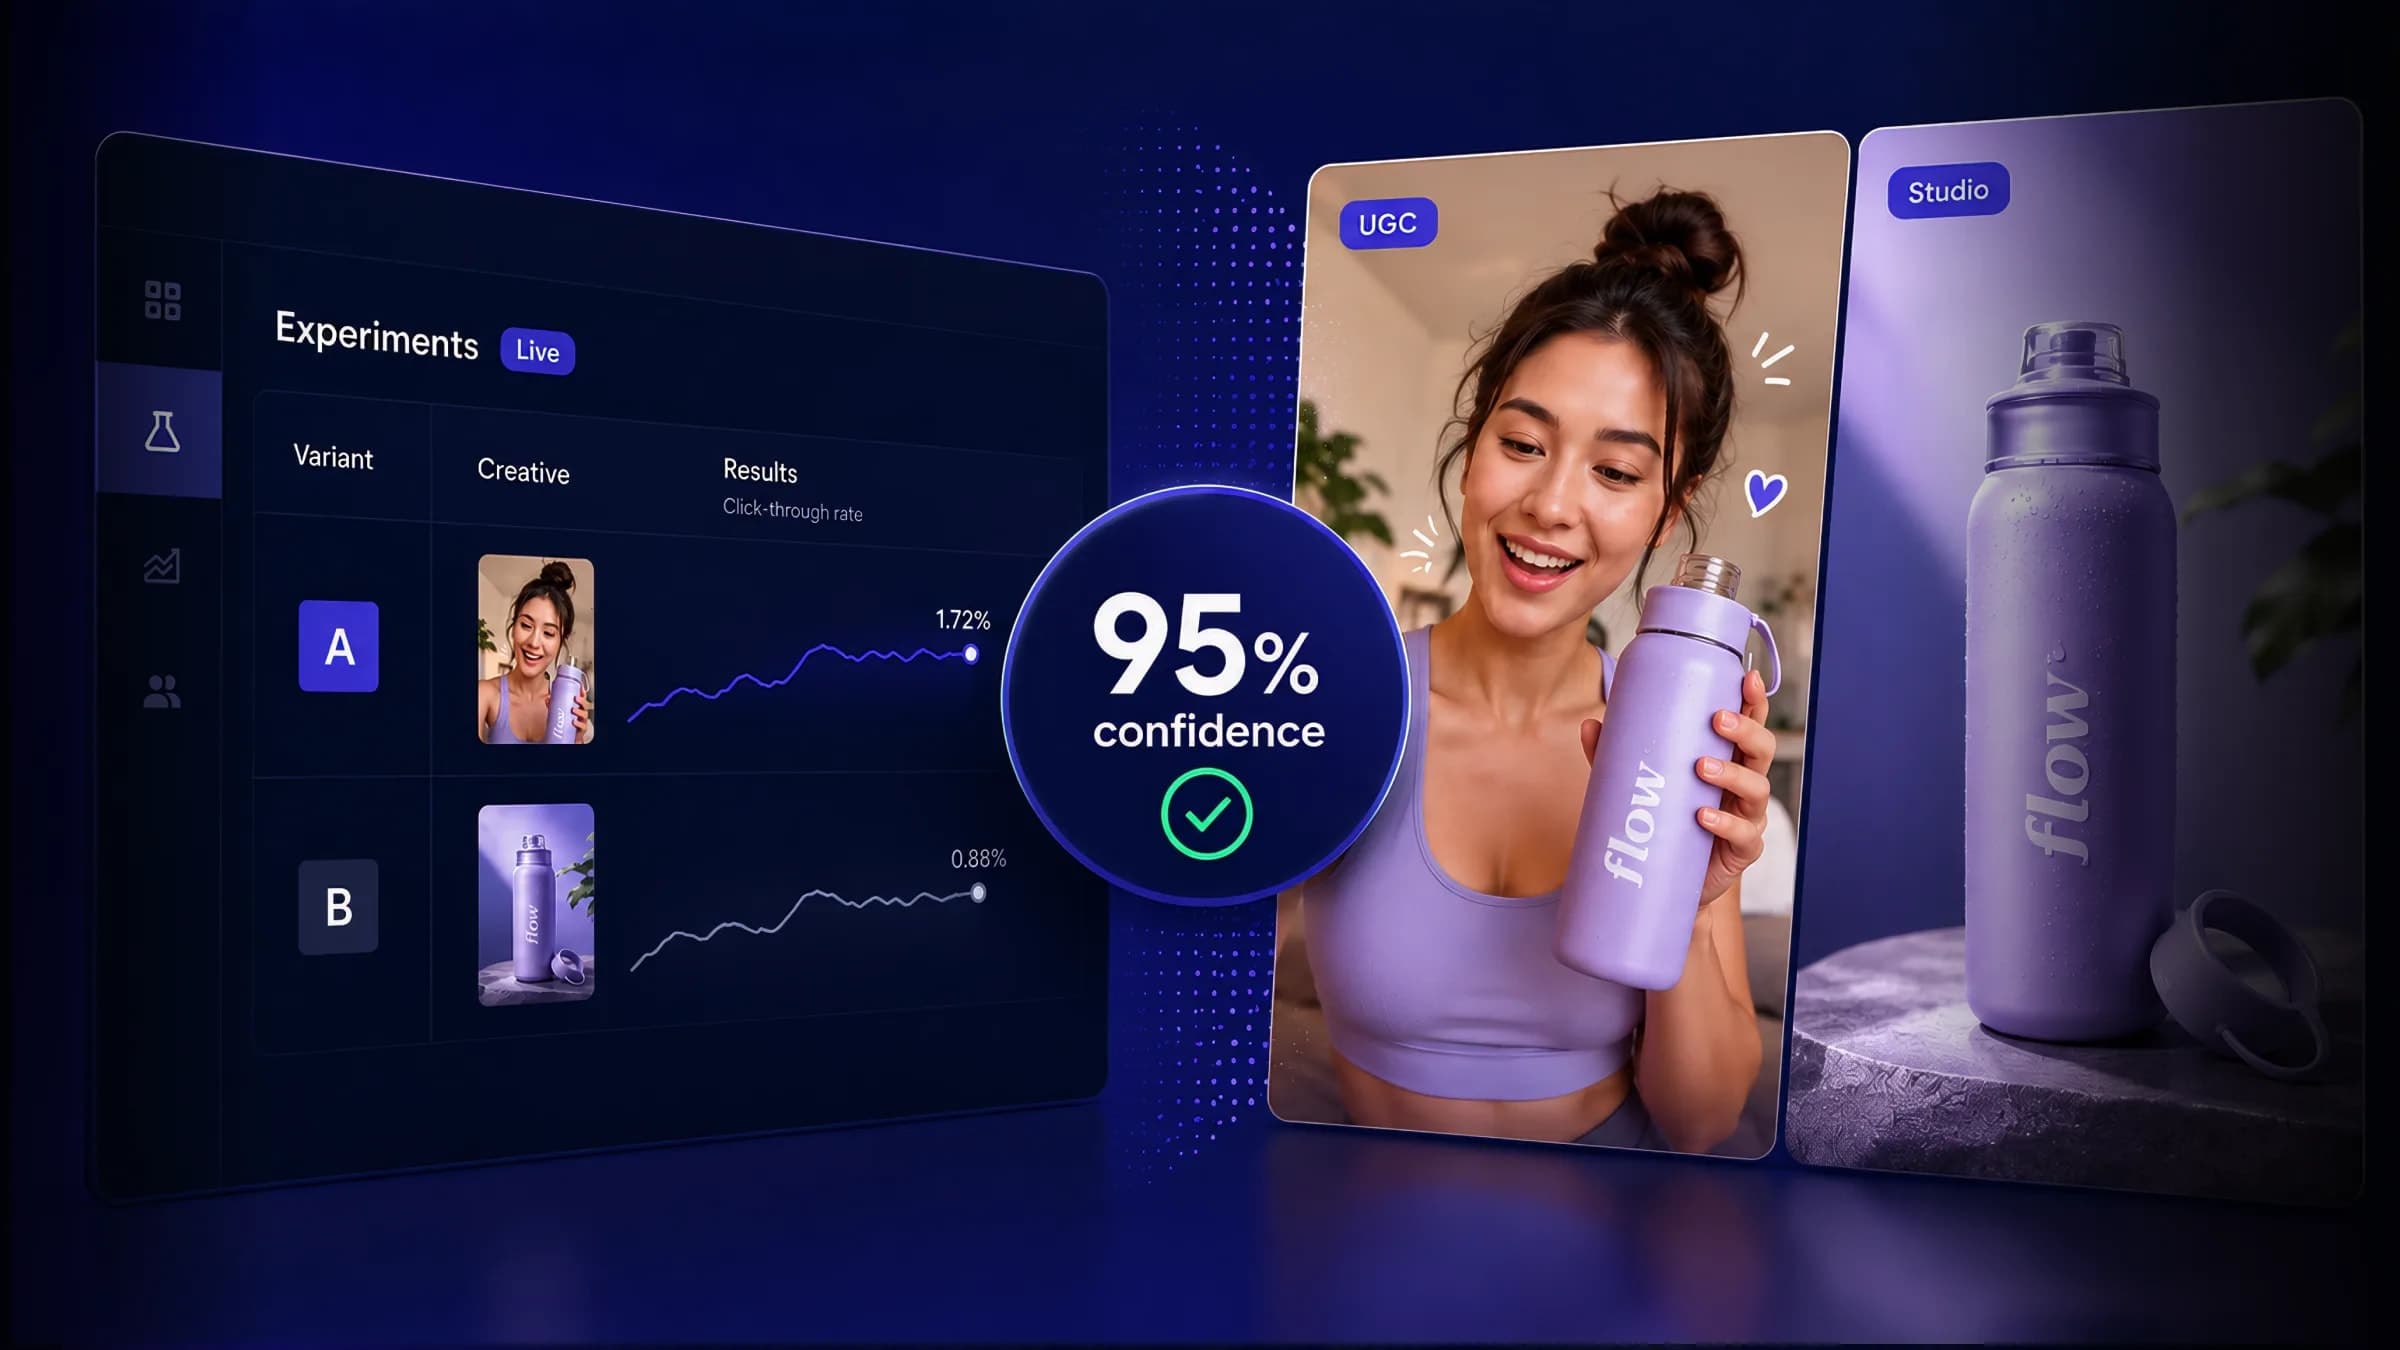
Most Meta creative tests declare false winners. This playbook covers hypothesis design, Meta Experiments setup, sample-size math, and the three-metric read that separates signal from noise.
AI-powered marketing tools

ThruPlay is a Meta-specific term, but the underlying mechanic — counting a view at a specific threshold — exists differently on TikTok, YouTube, and CTV. Here's how the metrics actually compare and where cross-platform benchmarks break down.
AI-powered marketing tools

Measure the true impact of your marketing campaigns by calculating incrementality. Understand which portion of your conversions would have happened organically versus those directly caused by your marketing efforts.
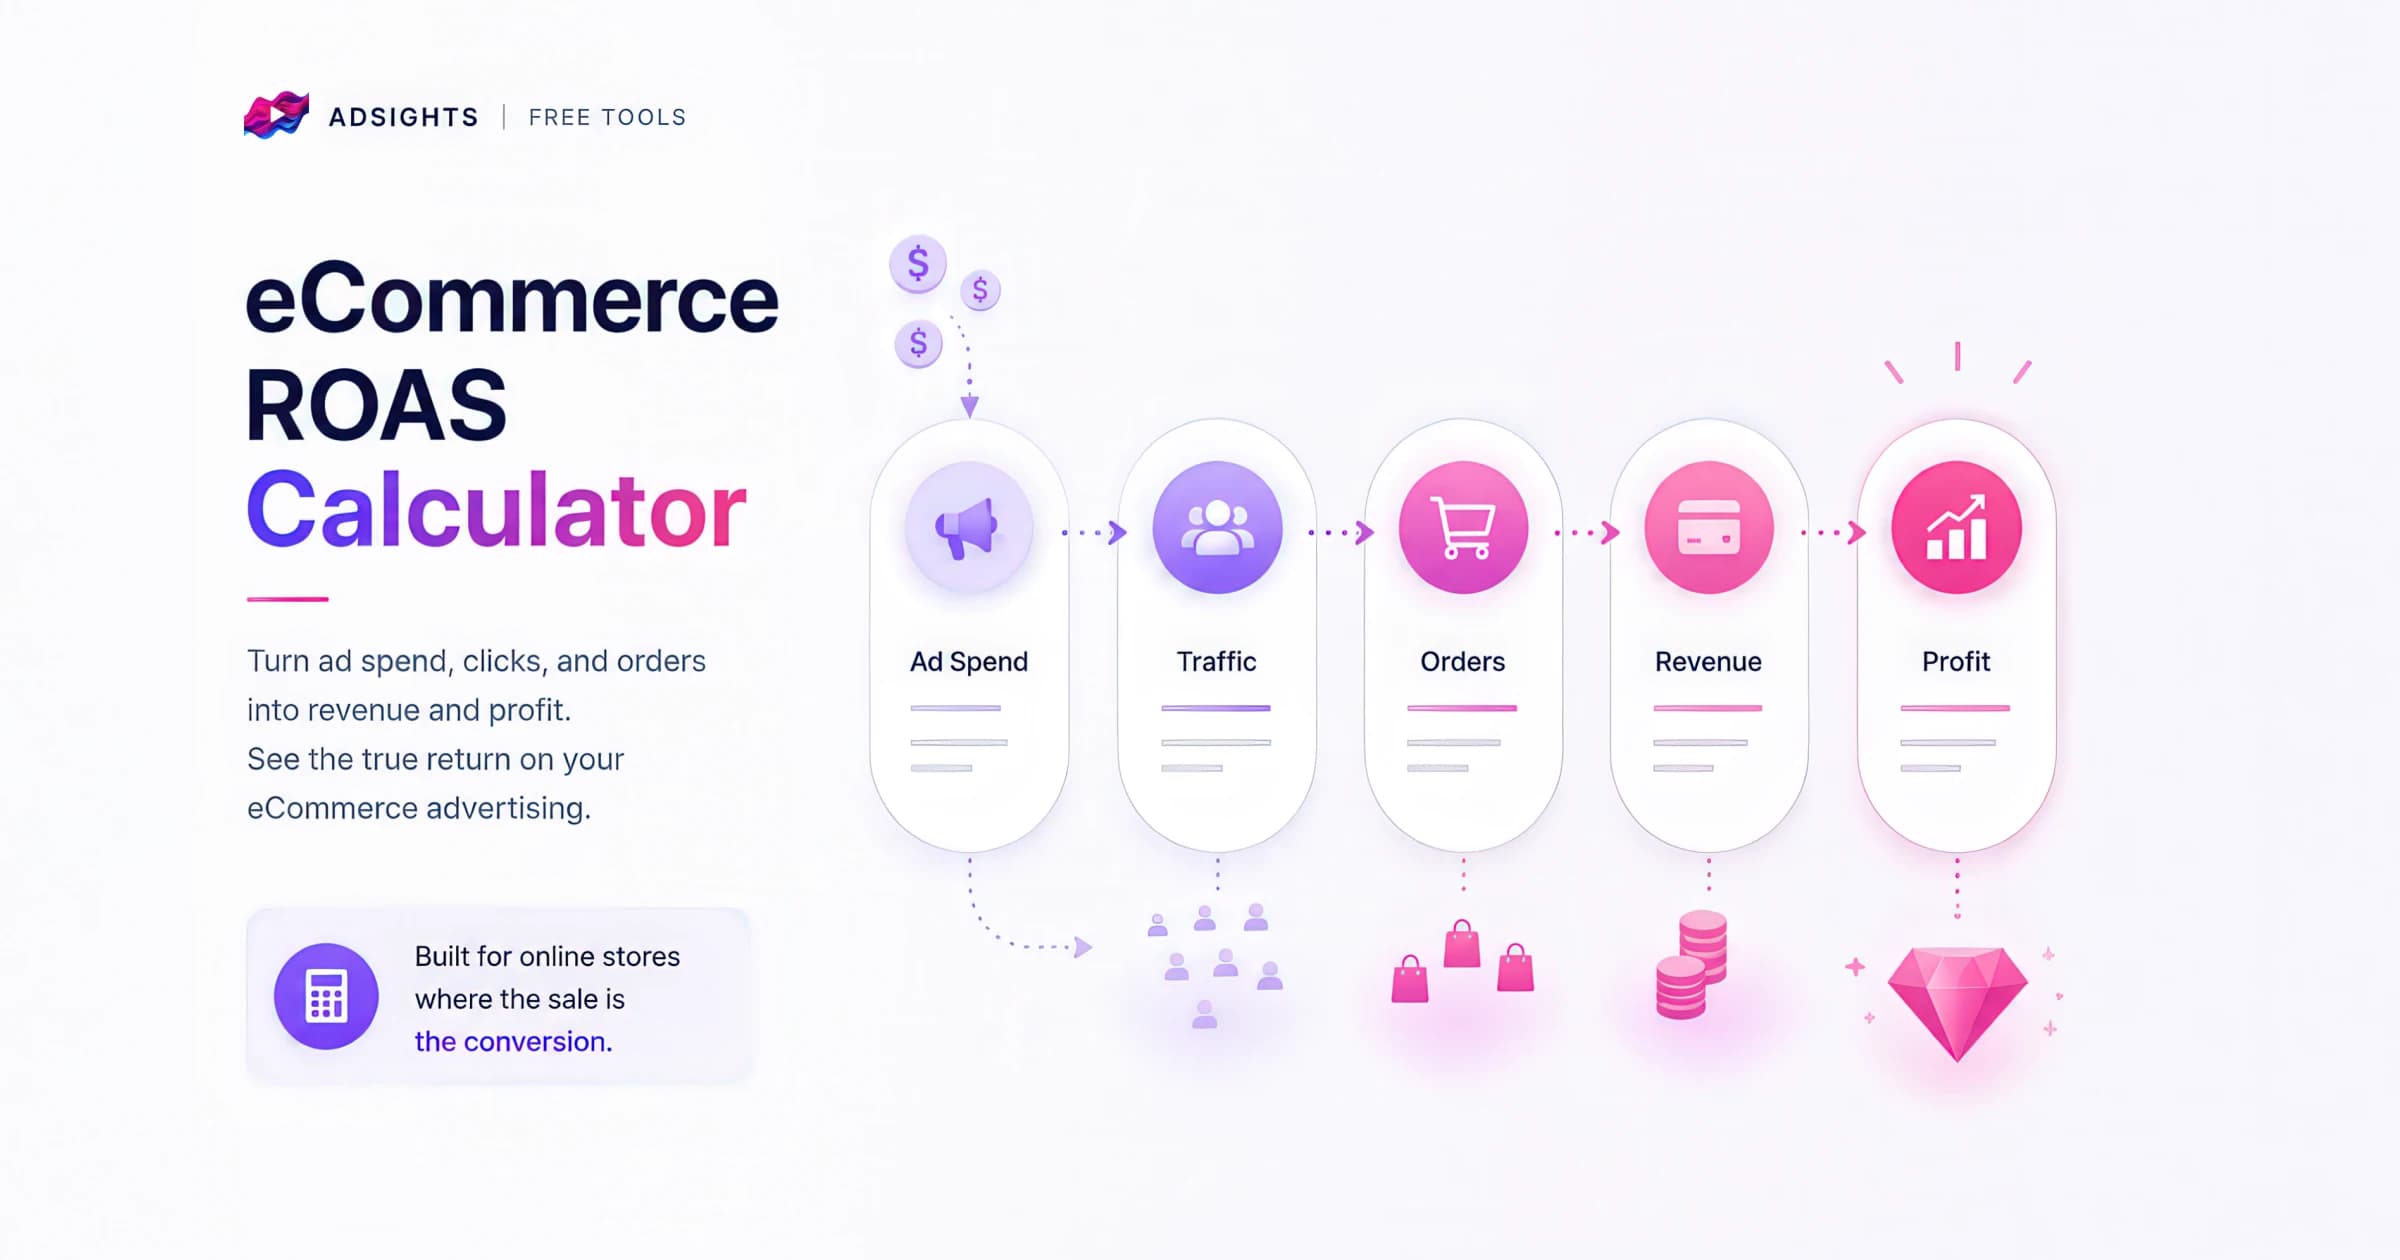
Free eCommerce ROAS calculator for online stores: turn ad spend, click cost, conversion rate, and average order value into return on ad spend and profit. Built for Shopify, DTC, and online-store paid media where the sale is the conversion.

Grade your ad creatives and get actionable recommendations for improvement. This creative quality grader tool evaluates key elements like visual design, messaging, CTAs, accessibility, and platform optimization to help you create high-performing ads across Facebook, Instagram, TikTok, and YouTube. Get detailed scores and personalized tips to optimize your creative strategy.
Conversion rate measures the percentage of users who complete a defined conversion action relative to the total number who had the opportunity to convert. This metric evaluates the effectiveness of marketing efforts, user experience, and overall funnel efficiency in driving desired outcomes. Conversion actions can range from purchases and form submissions to content downloads and subscription signups.
Ad variations are strategically developed versions of ad creative that modify specific elements for testing or audience targeting purposes. Each variation is created with clear hypotheses about performance impact, whether testing individual elements through A/B testing, exploring element interactions via multi-variate testing, or targeting different audience segments. These variations enable data-driven creative optimization through systematic performance comparison.
Click-Through Rate (CTR) measures the ratio of clicks to impressions for a digital advertisement, email, or other clickable content. It's a fundamental metric for evaluating creative relevance, audience targeting quality, and overall ad effectiveness in driving user engagement. CTR varies significantly by format, placement, and channel, making context crucial for performance evaluation.
Sample size refers to the number of observations or data points collected in a sample, and is a crucial factor in determining the precision of statistical estimates. In advertising, it directly impacts the confidence, reliability, and validity of metrics such as conversion rates, click-through rates, and return on ad spend (ROAS). The larger the sample size, the more reliable the results, as smaller samples can lead to more variability and less confidence in the conclusions drawn from the data.
Most marketing 'wins' are statistical noise. Learn the 4-question test, sample-size math, and confidence intervals that separate real signal from chance.
Are Your 'Insights' Just Measuring Noise Patterns or Is There Signal There?
In digital marketing, data-driven decision-making is often celebrated as the gold standard. Yet, at AdSights, we've observed a troubling trend in the siren song of 'data-driven' decision-making that has led many astray: marketers frequently mistake statistical noise—random fluctuations in data—for meaningful insights. This misunderstanding can lead to misguided strategies, wasted budgets, and missed opportunities.
The marketing industry, particularly in the digital realm, has long prided itself on being "data-driven" — but let's be honest: most of what passes for data-driven marketing is little more than a veneer of scientific respectability plastered over gut feelings and hasty conclusions. It's time we faced an uncomfortable truth: marketing, as practiced by most organizations today, is not a science. It's not even a pseudo-science. At best, it's an art form masquerading as data analysis.
Our mission at is to elevate marketing into a true science, a rigorous, evidence-based discipline. This means going beyond superficial data analysis and embracing scientific methodologies to accurately distinguish genuine signals from statistical noise. This isn't just about using more data or running more tests. It's about fundamentally changing how we approach marketing decisions, how we interpret results, and how we distinguish between genuine insights and the ever-present static of statistical noise.
To truly grasp the challenge we face, we need to dive deep into the concepts of statistical noise and signal. These aren't just academic terms; they're the key to unlocking truly effective, scientifically grounded marketing strategies.
To effectively interpret marketing data, it's essential to clearly understand two fundamental concepts:
Let's consider a real-world example that illustrates just how easy it is to mistake noise for signal:
It's tempting to declare the left-tilting ad the winner and reallocate your entire budget to it. After all, that's a 27% improvement in CTR! But hold on-is this a real insight, or are we just seeing noise?
Here's where many marketers go wrong. They see a difference in numbers and immediately assume it's meaningful; but let's think about this critically. Is there any logical reason why a slight tilt in the product image would cause such a significant difference in user behavior? More importantly, is this difference consistent over time and across larger sample sizes?
The reality is that in the complex ecosystem of digital advertising, countless factors influence performance metrics at any given moment. The time of day, the specific users who saw the ad, even seemingly unrelated events like weather conditions or news headlines can all contribute to short-term fluctuations in performance[1]. Without rigorous testing, you risk mistaking random noise for meaningful insights.
This example underscores a crucial point: in marketing, as in science, we must be skeptical of our own conclusions. We must actively seek out alternative explanations and rigorously test our assumptions before declaring that we've found a meaningful signal amidst the noise.
To combat the misleading effects of statistical noise, we turn to a fundamental principle of probability theory: the Law of Large Numbers. This isn't just an academic concept—it's a powerful tool that can help us separate genuine insights from random fluctuations.
The Law of Large Numbers states that as a sample size grows, its mean will converge on the true population mean. In simpler terms, the more data we collect, the more likely we are to see the real underlying trends rather than being misled by short-term fluctuations.
Returning to our water bottle example:
What we see here is the Law of Large Numbers in action. As we collect more data, the performance of both ads converges towards their true average performance. The initial difference we observed was just noise—random fluctuation that disappeared as our sample size increased.
This principle has profound implications for how we approach marketing decisions. It suggests that we need to be much more patient and deliberate in our analysis than many marketers are accustomed to. Quick reactions based on limited data are more likely to lead us astray than to provide genuine insights.
This approach might seem overly cautious or even impractical to some. After all, in the fast-paced world of digital marketing, there's often pressure to make quick decisions and constantly optimize campaigns. But consider the alternative: making decisions based on noise leads to a constant cycle of reacting to phantom signals, wasting resources, and ultimately failing to achieve meaningful improvements in performance.
While the Law of Large Numbers provides a good theoretical framework for overcoming statistical noise, the practical realities of marketing often force us to work with smaller sample sizes than we'd like. This is where things get truly challenging, and where the line between science and guesswork often blurs.
Marketers often face practical constraints, forcing decisions based on limited data. Small sample sizes amplify the risk of misinterpreting random fluctuations as meaningful trends.
A single high-value purchase can skew performance metrics, creating misleading results.
Ad platforms (e.g., Meta/Facebook) require a learning phase (typically around 50 conversions) during which performance metrics fluctuate significantly.
Stakeholders often demand rapid optimization, leading marketers to prematurely act on incomplete data.
Marketers may incorrectly attribute random variations to specific factors (e.g., color psychology), creating false narratives.
Let's explore, in more detail, why small sample sizes are so problematic and how they can lead us astray:
Small samples are much more susceptible to being skewed by random events or outliers. Consider this scenario:
But is this a reliable indicator of your ad's performance? Of course not. This single purchase, while great for your bottom line, tells you very little about how your ad will perform over time with a broader audience.
Early performance data, especially with small sample sizes, can be highly misleading. This is partly due to how ad platforms operate. Many platforms have a "learning phase" where they're figuring out the best audience for your ad. During this phase, performance can be highly volatile[2].
For example, Meta (Facebook) ads typically require a learning phase where they need to gather approximately 50 optimization events before their delivery system stabilizes[3]. Before reaching this threshold, performance metrics can swing wildly from day to day. Making optimization decisions during this phase is essentially shooting in the dark.
Despite the statistical realities, marketers often face pressure to make quick decisions. This pressure can come from various sources:
Stakeholders often demand quick wins and regular updates, pushing marketers to make premature decisions.
The pressure to keep up with competitors' pace, even when they may just be chasing statistical noise.
Rapidly changing trends and platform dynamics foster a sense of urgency to make quick optimization decisions.
This pressure often leads to what we call "optimization theater"—making frequent, small changes to campaigns not because they're based on solid data, but because we feel we need to be doing something.
Small sample sizes can give us a false sense of control and understanding. When we see a trend in a small dataset, our pattern-seeking brains want to assign meaning to it. This can lead to what statisticians call overfitting. Overfitting is when we create complex explanations for what are essentially random fluctuations.
For instance, you might notice that ads featuring people wearing blue perform 10% better than those featuring people wearing red. With a small sample size, this could easily be coincidence. But once we've noticed this "pattern," we might start building elaborate theories about color psychology and its impact on our audience, all based on what is likely just noise.
The problem of small sample sizes is compounded when we run multiple tests simultaneously, which is common in digital marketing, each test introduces more opportunities for random fluctuations to appear significant[4].
Let's say you're testing 10 different ad variants. Even if there's no real difference between them, purely by chance, one or two will likely perform better than the others in the short term. If you then double down on these "winners" without sufficient data, you're essentially making decisions based on statistical artifacts rather than genuine insights.
Acknowledging these challenges is the first step towards overcoming them. It is essential to resist the urge to react to every fluctuation in our data. Instead, we must cultivate patience, embrace uncertainty, and develop strategies that allow us to make decisions with incomplete information without falling into the trap of mistaking noise for signal.
Now that we've explored the challenges of distinguishing signal from noise, let's dive into practical strategies for making informed decisions in the face of uncertainty. At AdSights, we've developed proven strategies that can help marketers move beyond the superficial application of data and towards a more rigorous, scientifically grounded practice that can aid in identifying genuine insights.
The journey towards truly data-driven marketing begins with selecting the right Key Performance Indicators (KPIs). This might seem straightforward, but it's an area where many marketers stumble, often without realizing it.
One of the most common pitfalls we see is the selection of KPIs that aren't actually relevant to the specific changes being tested. This misalignment can lead to false conclusions and misguided strategies.
Consider this scenario:
Now, you decide to measure the success of these ads based on the click-through rate (CTR) of the end card. After a week, you notice that Version A has a slightly higher CTR on the end card. Success, right?
Not so fast. The CTR on the end card tells you very little about the effectiveness of the opening scenes, which is what you were actually testing. In this case, a more relevant KPI might be the thruplay rate or the percentage of viewers who watch past the first 15 seconds. These metrics would give you more insight into how the different openings affect viewer engagement.
This example illustrates a crucial point: your KPIs must be directly influenced by the specific elements you're testing. Otherwise, you're not measuring what you think you're measuring, and any conclusions you draw will be inherently flawed.
Another key consideration in choosing KPIs is the distinction between leading and lagging indicators. Understanding this difference can dramatically improve your ability to make proactive, data-driven decisions.
Marketers should track both backward-looking and forward-looking indicators for a complete picture of performance.
Outcome-based metrics that show the results of past actions. These include metrics like , , and .
While crucial for understanding overall performance, lagging indicators often come too late to inform real-time decision-making.
Let's look at a practical example:
By closely monitoring your leading indicators, you notice a sudden drop in the Add-to-Cart Rate, even though your CTR remains stable. This early warning sign allows you to investigate and potentially address issues (like a website glitch or a competitor's flash sale) before they significantly impact your ROAS.
At AdSights, we advocate for a balanced approach that considers both leading and lagging indicators. This allows marketers to be proactive in their decision-making while still keeping an eye on the ultimate impact of their efforts.
In the digital marketing world, there's often an emphasis on constant testing and optimization. While the intention behind this approach is admirable, it frequently leads to a scattershot strategy that generates more noise than insight.
We've all seen it: marketers who pride themselves on running dozens of tests simultaneously, tweaking every conceivable variable in their ads. They might change the color of a button, adjust the wording of a headline, swap out images, all in the name of "optimization."
This approach is tantamount to throwing spaghetti at the wall to see what sticks. It's not scientific testing; it's random experimentation masquerading as strategy.
When you change multiple elements at once, it becomes impossible to isolate which change is responsible for any observed differences in performance.
The more tests you run simultaneously, the higher the chance of seeing false positives due to random fluctuations.
Rapid-fire testing often leads to shallow, tactical insights rather than deep, strategic understanding.
Constant testing consumes significant time and resources, often with diminishing returns.
Instead of this scattershot approach, we advocate for a more focused, hypothesis-driven testing strategy.
Effective testing starts with a clear hypothesis. This isn't just a guess or a hunch; it's a specific, testable prediction based on existing data and marketing theory[5].
Here's how this might look in practice:
This hypothesis is specific, measurable, and grounded in marketing theory (the concept of social proof). Now, we can design a controlled test to evaluate this hypothesis:
Framework for running a controlled experiment on user-generated content
Ad incorporating
By taking this approach, we're not just randomly trying things out. We're systematically building our understanding of what works and why. Even if our hypothesis turns out to be incorrect, we've gained valuable insights that can inform future strategies.
One of the hardest truths for many marketers to accept is the inherently probabilistic nature of our field. We're not dealing with the deterministic world of classical physics, where the same inputs always produce the same outputs. Instead, we're operating in a complex, dynamic system where countless variables interact in ways we can't always predict or control.
Many marketers fall into the trap of thinking they have more control over outcomes than they actually do. They might attribute a successful campaign entirely to their brilliant strategy, or blame a underperforming ad entirely on poor creative.
In reality, numerous factors outside our control influence campaign performance:
Broader market trends, recessions, inflation, and other economic factors that impact consumer spending behavior.
Unexpected promotions, product launches, or marketing campaigns from competitors that affect your market share.
Updates to social media, search engine, or advertising platform algorithms that can dramatically alter campaign performance overnight.
News events, viral phenomena, and cultural shifts that can either amplify or diminish your marketing message.
Acknowledging this uncertainty doesn't mean we can't make informed decisions. Instead, it should push us to adopt a more nuanced, probabilistic approach to decision-making.
Let's consider an example of how probabilistic thinking might apply in a real marketing scenario:
Instead of fixating on hitting exactly 3%, you might set up your campaign like this:
We will consider major changes to our strategy.
We will make minor optimizations.
We will consider the campaign successful and look for ways to scale.
We will investigate to understand what's driving the exceptional performance and how we can replicate it.
This approach acknowledges the inherent variability in marketing outcomes while still providing a framework for decision-making.
As we navigate the complexities of modern marketing, artificial intelligence (AI) emerges as a powerful ally in our quest to separate signal from noise. At AdSights, we've harnessed the power of AI to transform how marketers analyze and optimize their campaigns.
One of AI's greatest strengths is its ability to identify patterns in vast amounts of data—patterns that might be invisible to the human eye. This capability is particularly valuable in marketing, where we're often dealing with complex, multidimensional datasets.
For example, our AI-powered creative analysis system can analyze thousands of ad creatives across multiple campaigns, identifying subtle combinations of elements that correlate with higher performance. This goes far beyond simple A/B testing. Instead of just comparing two variants, AI can understand the interplay between numerous factors—color schemes, ad copy length, image composition, and more—to provide nuanced insights into what drives ad performance.
AI doesn't just help us understand past performance; it can also help predict future outcomes. By analyzing historical data and current trends, AI-powered predictive models can forecast how different ad variations are likely to perform.
This predictive capability is especially valuable for avoiding the pitfalls of short-term thinking. Instead of reacting to day-to-day fluctuations, marketers can use AI-generated forecasts to make more strategic, long-term decisions.
Another crucial role of AI in marketing analytics is anomaly detection. AI systems can quickly identify when performance metrics deviate significantly from expected patterns, alerting marketers to potential issues or opportunities.
For instance, if an ad's click-through rate suddenly drops, is this just random variation, or is it a sign of ad fatigue[6]? AI can help answer this question by considering a wide range of factors and historical patterns, providing marketers with actionable intelligence rather than just raw data.
As we've explored throughout this article, truly data-driven marketing is about much more than just collecting numbers. It's about developing a deep understanding of statistical principles, choosing the right metrics, designing thoughtful experiments, and leveraging advanced technologies to uncover meaningful insights.
Now that we have a solid foundation, let's recap our checklist:
Ensure your Key Performance Indicators (KPIs) directly measure the specific elements you're testing. For example, if testing video ad openings, measure video retention rates rather than end-card CTRs.
Predict future performance and allow proactive adjustments.
Measure past outcomes and validate overall effectiveness.
Avoid random experimentation ("throwing spaghetti at the wall")—instead, formulate clear, testable hypotheses grounded in marketing theory and existing data.
Design controlled experiments with defined control and test groups, clear metrics, and sufficient duration to achieve statistical significance (typically 95% confidence)[7].
Marketing outcomes are inherently uncertain. Adopt a probabilistic mindset by setting realistic performance ranges rather than fixed targets. For example, if your expected conversion rate is 3%, plan actions for various scenarios:
Artificial intelligence (AI) can significantly enhance your ability to distinguish signal from noise through:
Identifying subtle correlations across large datasets.
Forecasting future performance based on historical data.
Quickly flagging unexpected deviations in performance metrics.
At AdSights, our mission is to elevate marketing from a haphazard, gut-feeling-driven practice to a rigorous, scientific discipline. This doesn't mean removing creativity or human intuition from the equation. Instead, it's about providing marketers with the tools and knowledge they need to make informed decisions, test their ideas systematically, and continually refine their strategies based on solid evidence.
The path to truly scientific marketing isn't easy. It requires us to embrace uncertainty, challenge our assumptions, and sometimes admit that we don't know as much as we thought we did. But the rewards – more effective campaigns, better ROI, and a deeper understanding of our audiences – make this journey worthwhile.
As you move forward in your marketing efforts, we encourage you to:
Always look for alternative explanations and be willing to challenge your assumptions.
Develop clear hypotheses, design controlled experiments, and be prepared to accept results that contradict your expectations.
Understand that marketing outcomes are influenced by numerous factors, many outside your control.
Use AI and advanced analytics not as a replacement for human judgment, but as tools to enhance your decision-making.
By adopting these principles, we can collectively move towards a future where marketing is not just data-driven, but truly data-intelligent. A future where we can confidently distinguish between meaningful signals and distracting noise, making decisions that drive real business impact.
At AdSights, we're committed to leading this transformation, providing marketers with the tools, insights, and methodologies they need to thrive in the complex world of modern marketing. Together, we can elevate marketing to the science it has the potential to be.
Expand each section to learn about common statistical errors that lead marketers astray
Marketers often ignore the underlying probability of an event (the base rate) when evaluating performance. For example, if a campaign shows a 20% conversion rate increase, but the base conversion rate was only 1%, the actual improvement is just 0.2 percentage points—potentially within the range of statistical noise.
When running numerous tests simultaneously (like testing dozens of ad variations), you increase the likelihood of seeing "significant" results by pure chance. Without proper statistical corrections, this leads to false positives.
Extreme results (very high or very low performance) tend to move closer to average over time. Marketers often mistake this natural statistical phenomenon for the effect of their interventions.
The tendency to search for, interpret, and recall information that confirms pre-existing beliefs. This leads marketers to emphasize data that supports their hypotheses while dismissing contradictory evidence as "outliers."
Random variations in data that do not reflect actual trends or meaningful patterns. Think of it as static interference on a radio—noise that obscures the true message.
Genuine patterns or trends in data that reflect real changes in audience behavior or campaign performance. It's the clear, meaningful message we're striving to discern amidst the cacophony of noise.
This data shows how underlying signals can be obscured by noise. The moving average helps identify the true pattern beneath random fluctuations. Interactive controls allow adjusting signal-to-noise ratio and smoothing parameters.
| Point | Noisy Data | 10-pt Moving Average |
|---|---|---|
| 1 | 3.22 | 3.22 |
| 2 | 3.07 | 3.15 |
| 3 | 6.48 | 4.26 |
| 4 | 6.62 | 4.85 |
| 5 | 6.14 | 5.11 |
| 6 | 5.68 | 5.20 |
| 7 | 5.87 | 5.30 |
| 8 | 5.19 | 5.28 |
| 9 | 6.20 | 5.39 |
| 10 | 7.20 | 5.57 |
| 11 | 5.83 | 5.83 |
| 12 | 5.08 | 6.03 |
| 13 | 7.07 | 6.09 |
| 14 | 6.77 | 6.10 |
| 15 | 5.49 | 6.04 |
| 16 | 5.69 | 6.04 |
| 17 | 5.42 | 5.99 |
| 18 | 6.15 | 6.09 |
| 19 | 5.41 | 6.01 |
| 20 | 7.58 | 6.05 |
| 21 | 5.46 | 6.01 |
| 22 | 7.00 | 6.20 |
| 23 | 4.84 | 5.98 |
| 24 | 3.88 | 5.69 |
Imagine you're running a Facebook ad campaign for a new line of eco-friendly water bottles. You create two nearly identical ads - the only difference is that in one, the bottle is tilted slightly to the left, and in the other, it's tilted slightly to the right. After a day of running both ads, you notice that the "left-tilting" ad has a click-through rate (CTR) of 2.8%, while the "right-tilting" ad has a CTR of 2.2%.


A visual demonstration of how random variation can masquerade as meaningful insights
This visualization demonstrates a fundamental statistical principle: with sufficient data, random variations (noise) fade away, revealing the true performance (signal). When working with small sample sizes, apparent differences are often just statistical noise. To make truly data-driven decisions, marketers must collect adequate data and resist the urge to act on early results.

You're running a campaign for a high-end luxury watch. Your target is $500. In the first day of your campaign, you get lucky—a wealthy watch enthusiast sees your ad and makes a purchase worth $10,000. Your for that day looks amazing!


Hypothesis: "Including user-generated content (UGC) in our ad creative will increase engagement rates by at least 15% compared to our standard product-focused ads, as it will enhance social proof and relatability."


Predictive metrics that can signal future performance. These might include metrics like Click-Through Rate (CTR), Engagement Rate, or Add-to-Cart Rate.
By focusing on leading indicators, marketers can identify potential issues or opportunities before they significantly impact bottom-line results.
Engagement Rate (e.g., video views, likes, comments)
Run until we reach statistical significance (e.g., 95% confidence level)
Personal situations affecting purchase decisions, such as recent payday, financial hardship, emotional state, or employment changes.
View each campaign, successful or not, as an opportunity to gain insights and refine your understanding.
After just 1,000 impressions per variant, the data seems to tell a clear story
1,000 impressions
CTR
2.8%
+27%Seemingly outperforming the alternative
1,000 impressions
CTR
2.2%
Underperforming in early days
At this point, many marketers would declare the left-tilting ad the winner with its impressive 27% higher click-through rate. This appears to be a significant gap.
After collecting 10,000 impressions per variant, the story completely changes:
10,000 impressions
CTR
2.3%
-17.9%Performance declining with larger sample
10,000 impressions
CTR
2.45%
+11.4%Now outperforming by 6.5%
With more data, our "insight" has completely reversed. The initially "losing" ad variant is now outperforming the "winner" by 6.5%. Had we reallocated our budget on Day 1, we would have made the wrong decision.
After 50,000 impressions per variant, we finally see the truth
50,000 impressions
CTR
2.35%
+2.2%Performance stabilized with large sample
50,000 impressions
CTR
2.36%
-3.7%Virtually identical performance
After collecting sufficient data, we can see that there's virtually no difference between the variants (just 0.4%). The dramatic differences observed earlier were merely random fluctuations - statistical noise masquerading as insights.
Watch how the performance gap closes as sample size increases
After 1,000 impressions
Performance Gap
27%
A seemingly significant 27% advantage
After 10,000 impressions
Performance Gap
-6.5%
ReversedCompletely reversed to a 6.5% disadvantage
After 50,000 impressions
Performance Gap
-0.4%
ConvergedConverged to a negligible 0.4% difference